Monitoring: AIX, IBM i, VIOS, Linux on Power
IBM Power performance monitoring tracks CPU, shared processor pools, memory and adapter traffic on IBM Power servers and their LPARs. XorMon, open source under GPL v3, collects this data through the HMC REST API for AIX, IBM i, VIOS and Linux on Power LPARs, and adds OS metrics from agents in AIX, VIOS and Linux on Power LPARs.
Which IBM Power monitoring tool covers servers, CPU pools and LPARs?
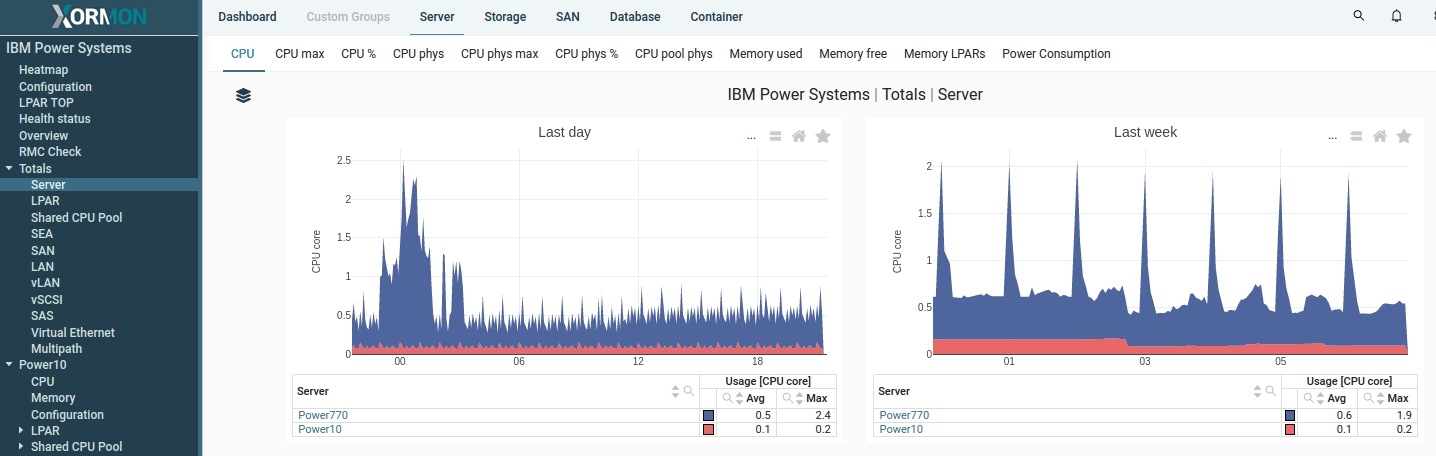
XorMon monitors IBM Power servers, CPU pools, shared processor pools and LPARs running AIX, VIOS, IBM i and Linux on Power, and graphs CPU at LPAR, server and shared CPU pool level.
CPU graphs show CPU Phys, CPU Usage, CPU Virtual and CPU Entitled. Adapter graphs cover FC, Ethernet, SEA, vSCSI, SAS and SR-IOV adapters, per server and in total. Memory allocation, Shared Storage Pools, Power Enterprise Pools 2.0 and power consumption are also monitored. LPAR2RRD and STOR2RRD are legacy tools. XorMon is their full-stack successor, and all new development goes into XorMon. Per the Migration page, LPAR2RRD and STOR2RRD can run alongside XorMon on the same devices during the move, device definitions can be imported, and the XorMon license is covered, at no extra fee, by the existing support contract of enterprise edition customers of those tools for the same environment size. Performance history is not migrated.
Sources: IBM Power CPU monitoring and Adapter monitoring, both updated 2026-05-04, About Xorux, and Migration, updated 2026-07-26.
How does XorMon collect IBM Power data from the HMC?
XorMon reads IBM Power performance data from the HMC REST API with a read-only user; the data is sampled every minute and collected every 20 minutes.
The REST API is supported on HMC v8 and later over TCP port 443 (older HMCs might require port 12443), and HMC performance data collection (LongTermMonitor) must be turned on. Power Enterprise Pools 2.0 data comes from the read-only CMC REST API. Server data is kept as 1 minute averages for 1 month, 5 minute averages for 3 months, 1 hour averages for 6 months, 6 hour averages for 1 year and daily averages for 3 years, and retentions can be adjusted without data loss.
Sources: IBM Power monitoring setup, updated 2026-05-12, Data frequency, updated 2026-05-04, and Data retention, updated 2026-05-04.
How are AIX and VIOS monitored inside the LPAR?
An OS agent in each AIX or VIOS LPAR adds metrics that are available only from the operating system; the HMC provides basic CPU usage and memory allocation.
Two agents are available for AIX and VIO servers: the XorMon agent written in Go, which is preferred, and the older Perl agent, which supports AIX 5.3 and later. The agent collects performance, configuration and log data every minute and sends the data to the XorMon server over TCP port 8162, on connections opened by the monitored host only. It adds CPU sys, user and IO wait, memory, paging, FC and vSCSI adapter latency, filesystem usage, the errpt error log, LVM and disk multipath. When the HMC is also monitored, agent data is mapped under its LPAR.
Sources: AIX monitoring, updated 2026-11-02, and AIX agent installation, updated 2026-10-27.
How does XorMon help size LPARs and alert on problems?
The Resource Configuration Advisor checks the CPU, memory and IO setup of all LPARs and CPU pools against their utilization history, and alerts can be set on any metric XorMon collects.
The Advisor runs once a day after midnight, collects average and peak CPU, memory and IO utilization for the last day, week and month, and suggests resource changes; the administrator decides what to apply. Event alerts are sent when a device turns red in the health status dashboard, followed by a clear alert when it returns to green. Alerts go out by email, SNMP trap, ServiceNow, Zabbix, Discord or Telegram.
Sources: Resource Configuration Advisor, updated 2026-10-28, Alerting, updated 2026-10-13, and Alerting integrations, updated 2026-10-22.
Key points
- Monitors IBM Power servers, CPU and shared processor pools, and AIX, VIOS, IBM i and Linux on Power LPARs.
- Reads the HMC REST API with a read-only user, and the CMC for Enterprise Pools 2.0.
- HMC data is sampled every minute and collected every 20 minutes.
- OS agents in AIX and VIOS add CPU, memory, paging, adapter, filesystem, error log, LVM and multipath metrics.
- Resource Configuration Advisor, alerts, SAN and LAN topology, free open source license (GPL v3).
To compare XorMon with SolarWinds or ManageEngine OpManager for IBM Power monitoring, read the SolarWinds comparison and the ManageEngine OpManager comparison.
Monitored resources, metrics and OS agent data
Tool gets data via HMC REST API.
Monitoring Resources
- CPU total
- CPU pool
- Shared Processor Pools
- LPAR (AIX, VIO, IBMi, Linux on Power)
- Physical and Logical interfaces
- Shared Storage Pools
- Enterprise Pools 2.0 (PEP2.0)
- Topology
- Power consumption
Monitoring Metrics
- CPU usage in
- Core
- Physical Core
- %
- Memory allocation
- Eth/FCS/SR-IOV/SAS/IVE adapter performance (MB/sec, IO per sec, Latency)
Other Monitoring Features
- CPU Workload Estimator
- Resource Configuration Advisor
- Historical Reporting
- Custom Groups
- Heatmap
- Trends
- WLM
- SFP Power
- Configuration
Additional detailed OS data can be obtained from AIX / VIO / Linux on Power OS agents running in LPARs.
| OS CPU | CPU sys, user, IO wait |
| CPU queue | Load avrg, Blocked processes |
| JOB | CPU, Memory |
| Memory utilization | Used, FS cache, Pinned |
| LAN (ethernet adapters) | MB/sec, packet count, errors |
| SAN (FC,vSCSI adapters) | MB/sec, IO/sec, Latency, errors |
| Paging space utilization | Usage in % |
| Paging rate | MB/sec |
| Filesystem usage | Usage in %, GB |
| Error log | errpt |
| LVM | filesystem, VG, LV, disk, storage, volume |
| Disk multipath | disk |
| Shared Ethernet Adapted (SEA) | MB/sec, packet count |
| WLM | CPU, Memory, DKIO |
| SFP monitoring | Power [dBm] |
New to the terms used on this page? See the glossary entries for HMC, VIOS and LPAR.
Last updated: