XenServer Monitoring
XenServer monitoring tracks the performance of XenServer, Citrix Hypervisor and XCP-ng hosts, pools, virtual machines and storage. XorMon, open source under GPL v3, collects this data without an agent, from XCP RRD over XAPI or through the REST API, and graphs CPU, memory, LAN throughput, and storage throughput, IOPS and latency.
What does XorMon monitor on XenServer, Citrix Hypervisor and XCP-ng?
XorMon supports XenServer, Citrix Hypervisor and XCP-ng, and monitors four components: hosts, pools, virtual machines and storage.
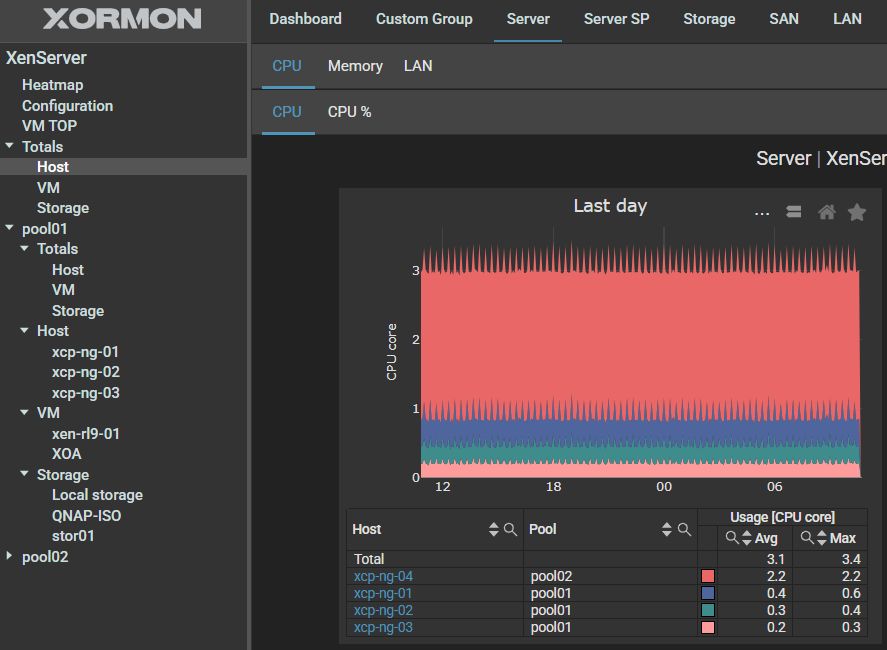
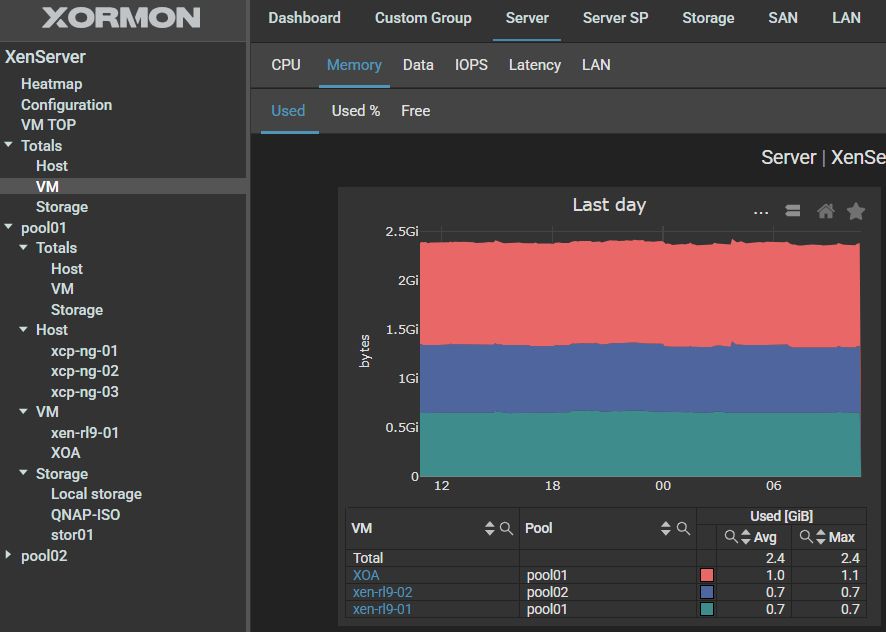
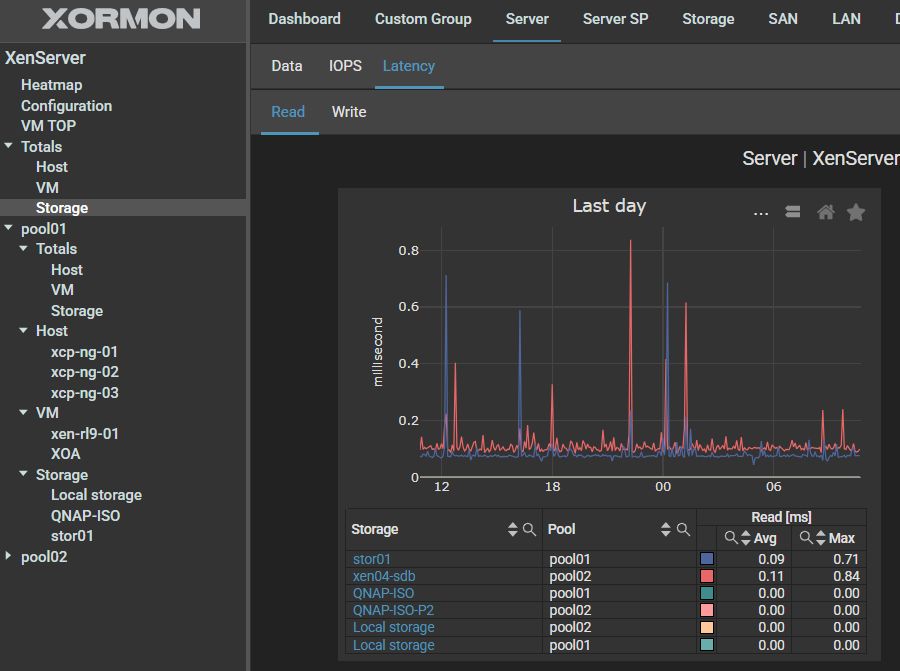
The monitored metrics are CPU cores and CPU %, memory used in MB and in %, memory free in MB, LAN throughput in MB/sec, storage throughput in MB/sec and in IOPS, and storage latency. Example graphs on this page show total host CPU, total VM memory and total storage latency. In the XorMon list of hypervisors, Citrix Hypervisor and XCP-ng appear under XEN: Citrix Hypervisor uses the XenServer host as its data source, and XCP-ng uses the XCP-ng host. Server data is kept as 1 minute averages for 1 month, 5 minute averages for 3 months, 1 hour averages for 6 months, 6 hour averages for 1 year and daily averages for 3 years, and retentions can be adjusted without data loss.
Sources: Hypervisor monitoring, updated 2026-10-06, and Data retention, updated 2026-05-04.
How does XorMon collect XenServer performance data?
XorMon is agentless and offers two collection methods: it reads XCP RRD data over XAPI from every XenServer host, over HTTPS on port 443, or uses the REST API.
The REST API method is listed for XenServer, Citrix Hypervisor and XCP-ng nodes in the installation overview, with connections from the node to the XorMon server on port 443. For the XAPI method, all hosts must be attached, and the XorMon host must be allowed to reach each of them. A user account is created on each XenServer host: it must be allowed to read data from commands such as xe ...-data-source-query and should have at least the Pool Admin role in XenServer Role Based Access Control (RBAC). With external authorization through AD, a read-only role can be used; on XenServer Free edition, or without RBAC configured, only the root user has the necessary privileges. The host is added in the XorMon UI under Settings, Device, Server, XenServer New, and its Test must show OK. About one hour later, after a browser reload, the XenServer data should appear in the XorMon UI.
Sources: XenServer installation, updated 2026-09-29, and XorMon installation overview.
Which XenServer configuration changes, capacity and topology data does XorMon track?
The Change Tracker watches XenServer and XCP-ng configuration items for hosts, storage, VMs and volumes; release 2.3.0 added datastore and disk capacity with capacity trends, and release 2.4.0 added Topology.
Watched items are CPU, CPU model, memory, sockets and XenServer version per host; physical size, physical usage and virtual allocation for storage; memory, OS, power state, vCPU, vCPU at startup and vCPU max per VM; and physical usage and virtual size per volume. Changes are listed in Settings, Change Tracker and on the configuration pages. The release notes link the capacity trends to Enhanced Predictions. Topology gives a graphical representation of how infrastructure components are interconnected, and XenServer is in its list of supported systems.
Sources: Change Tracker, updated 2026-10-19, Release notes 2.3, Release notes 2.4, and Topology, updated 2026-10-19.
How does XorMon alert on XenServer metrics?
XorMon alerting lets you set performance alerts with a threshold on any metric the tool collects, for all configured devices.
Alerts are configured under Settings, Alerting, Performance, once email groups are defined, and email alerts include graphs by default. Exclude hours stop threshold evaluation during a set window, such as a nightly backup, while quiet hours only stop notifications. Prediction alerting warns when a selected metric is predicted to reach its threshold within a set number of days. Alerts are sent by email, SNMP trap or one of the other alerting integrations.
Sources: Alerting, updated 2026-10-13, and Alerting integrations, updated 2026-10-22.
Key points
- Supports XenServer, Citrix Hypervisor and XCP-ng, with host, pool, VM and storage components.
- Agentless, with two methods: XCP RRD over XAPI from every host over HTTPS on port 443, or the REST API.
- Graphs CPU, memory used and free, LAN throughput, and storage throughput, IOPS and latency.
- Change Tracker, datastore and disk capacity with trends, and Topology.
- Threshold alerts on any collected metric, free open source license (GPL v3).
XenServer monitored components, metrics and examples
XenServer, Citrix Hypervisor and XCP-ng are supported.Implementation is agent less, XCP RRD is the data source
Monitored components
- Host
- Pool
- VM
- Storage
Monitored metrics
- CPU core
- CPU %
- Memory used MB
- Memory used %
- Memory free MB
- LAN throughput MB/sec
- Storage throughput MB/sec
- Storage throughput IOPS
- Storage latency
Examples
Total Host: CPU
 |
Total VM: Memory
 |
Total storage: Latency
 |
Last updated: