Nutanix Monitoring
Nutanix monitoring covers clusters, AHV hosts, virtual machines and the storage pools, containers and disks behind them. XorMon, open source under GPL v3, reads Nutanix data from Prism Central or Prism Element through the REST API with a View user role, and graphs capacity, CPU usage, memory usage and network throughput, with topology and alerting.
What does Nutanix monitoring cover?
Nutanix monitoring tracks the capacity and performance of Nutanix clusters, from the AHV hosts and virtual machines down to the storage pools, storage containers and disks.
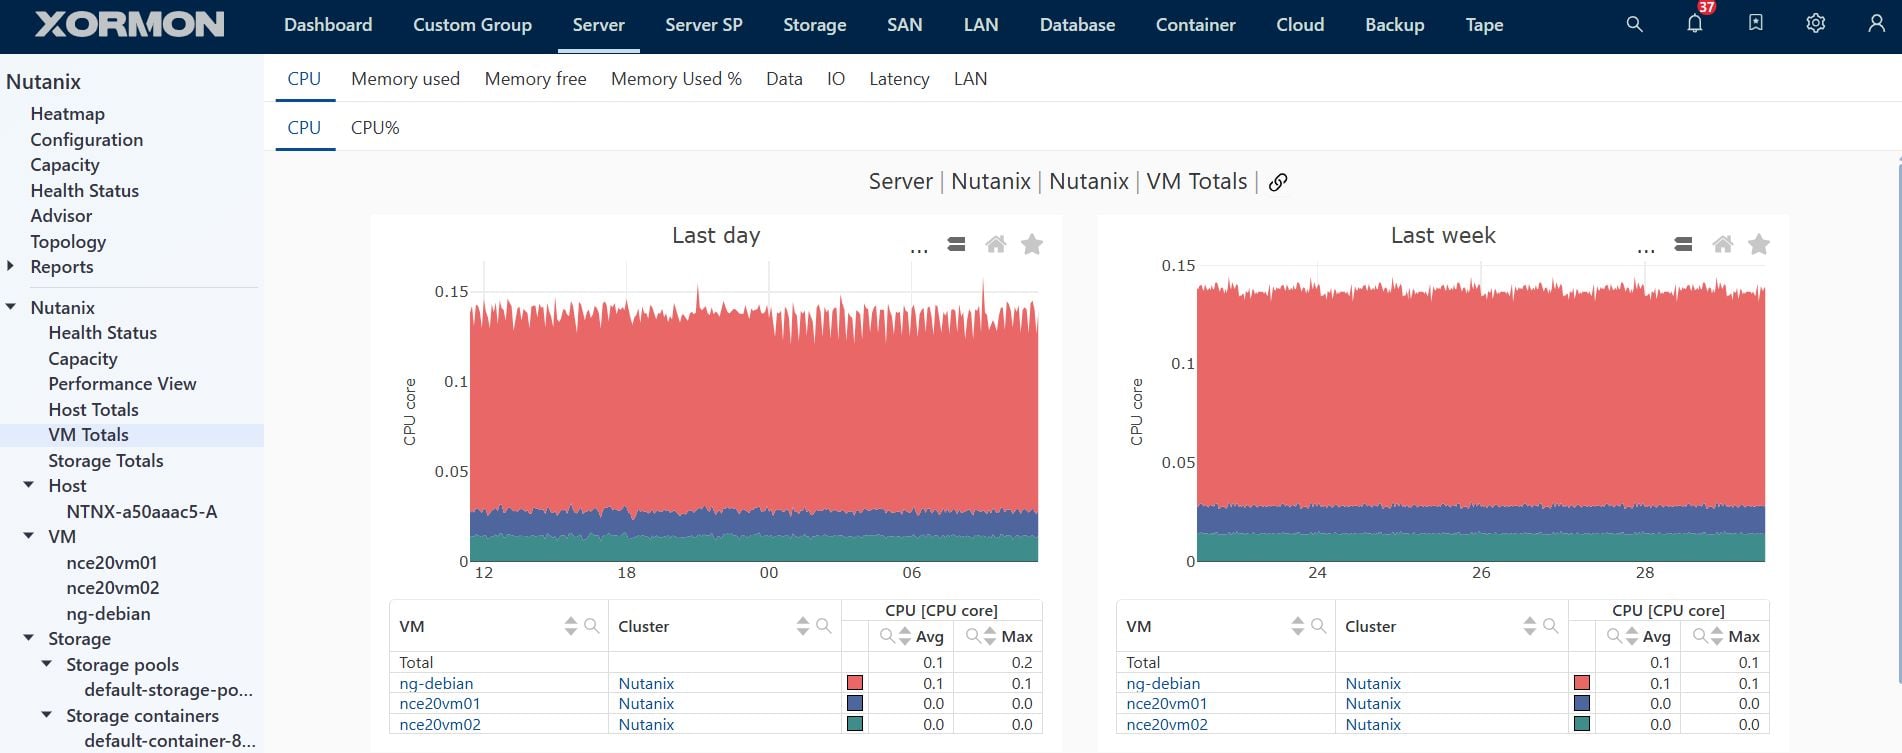
In XorMon, the Nutanix inventory holds clusters, hosts, VMs, disks, virtual disks, storage pools and storage containers. This hardware table can be exported to CSV through the public API, and hosts, storage pools, storage containers and VMs can be combined into custom groups. When a Linux VM running on Nutanix also has the XorMon OS agent, the agent data is mapped to that VM.
Sources: CMDB hardware table and Custom groups, both updated 2026-05-04, Hypervisor monitoring, updated 2026-10-06, and Linux agent, updated 2026-10-21.
How does XorMon work with Nutanix Prism?
XorMon reads Nutanix data through the REST API of Prism Central, a single collection point for all clusters, or of Prism Element, one cluster at a time. Both options provide the same data set.
XorMon connects with a user that has the View role. On Prism Element, a user created without any role gets View by default; on Prism Central, the user receives the Prism Viewer role through Authorization Policies, with full access in the scope definition. The XorMon host must reach the Prism hosts on HTTPS port 9440. Prism Central or Prism Element is then added under Settings, Device, Server Virtualization, Nutanix; the Test must show OK, and the data shows in the UI after about an hour. The XorMon virtual appliance can itself run on Nutanix, imported as a disk image in the Prism UI.
Sources: Nutanix monitoring installation, updated 2026-06-19, and Virtual appliance, updated 2026-10-27.
Which Nutanix metrics does XorMon collect, and how often?
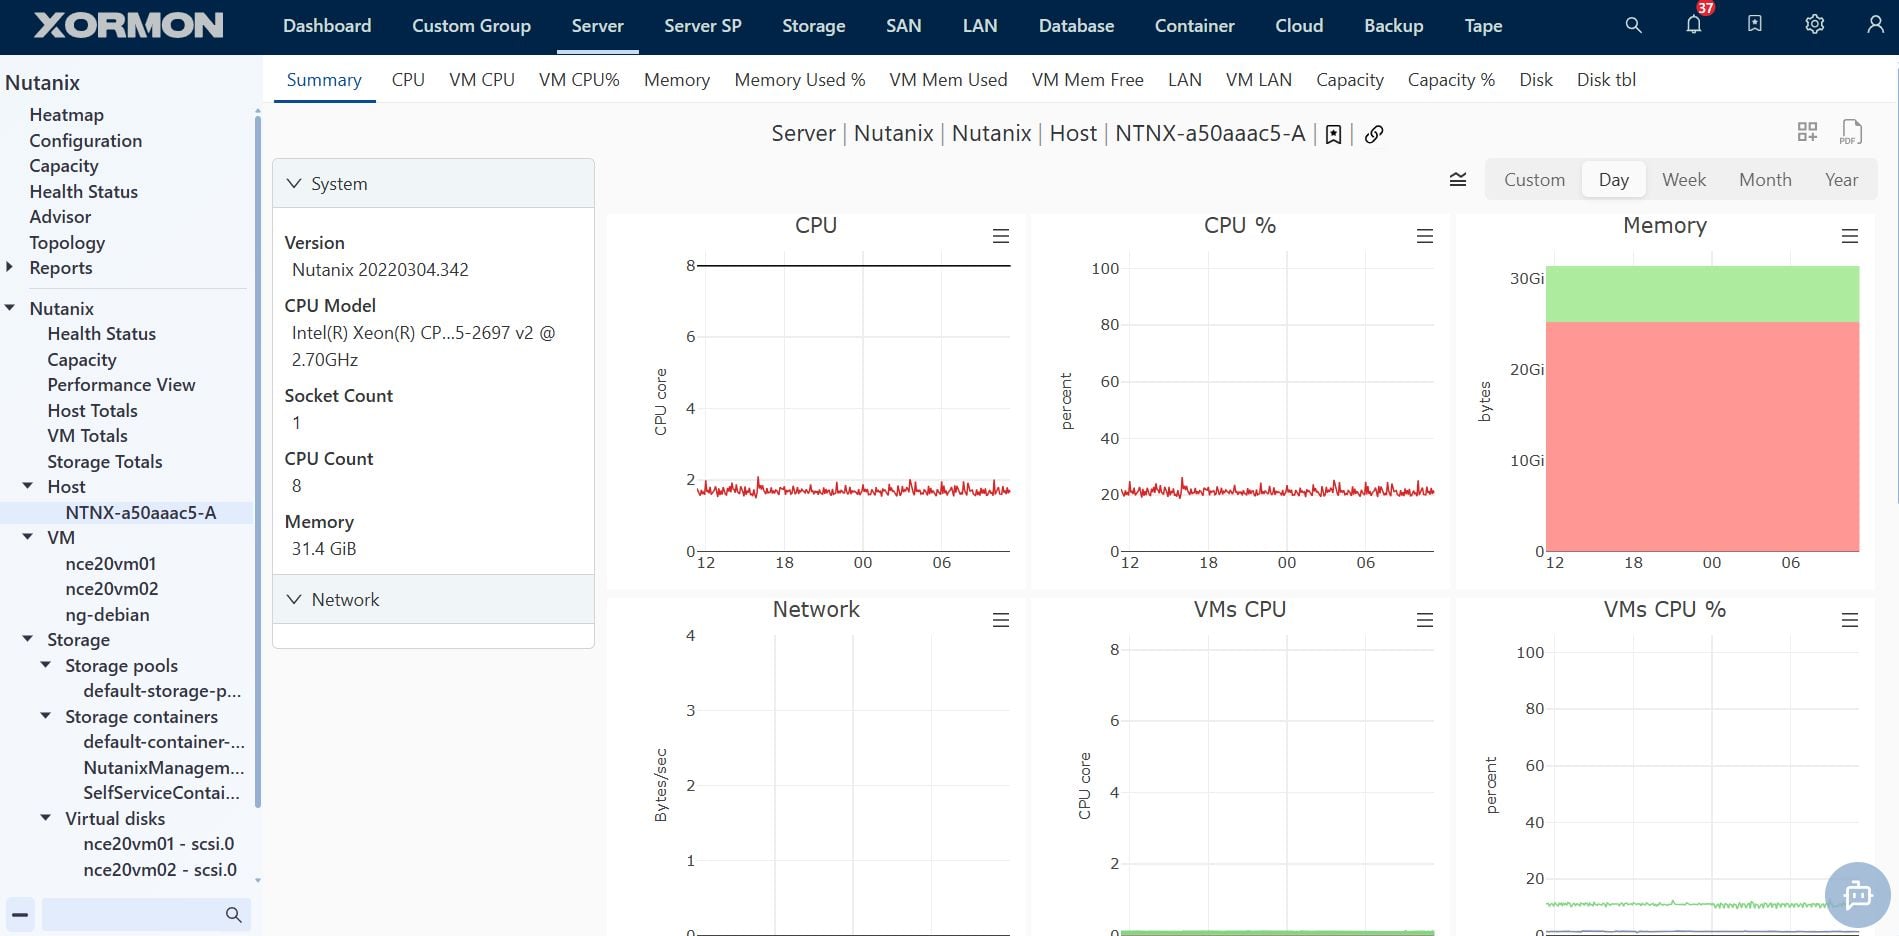
Through the Prism Central REST API, XorMon samples Nutanix data every minute and collects it every 20 minutes. It graphs capacity per cluster, host and disk, host network throughput and memory usage.
Host and VM NIC tables came with version 2.4, based on Nutanix API v4, together with host network throughput and memory usage %; datastore and disk capacity, with capacity trends, came with version 2.3. Server data is kept as 1 minute averages for 1 month, 5 minute averages for 3 months, 1 hour averages for 6 months, 6 hour averages for 1 year and daily averages for 3 years, and retentions can be adjusted without data loss.
Sources: Data frequency and Data retention, both updated 2026-05-04, and release notes 1.7, 2.3 and 2.4.
How does XorMon alert on Nutanix issues and map VMs to storage?
XorMon alerts on any collected Nutanix metric and when a device turns red in the global health status, and maps the logical links between VMs, storage containers and storage pools.
Alerts can be sent by email, SNMP trap, ServiceNow, Zabbix, Discord or Telegram. For event alerts raised when a device turns red, a clear alert follows when it returns to green. Nutanix Topology offers an overview, a view of all VM connections and a custom view; clicking a VM highlights its path to the datastore and storage volume. The Resource Configuration Advisor runs once a day, compares the CPU, memory and IO setup of VMs with their utilization over the last day, week and month, and suggests changes.
Sources: Alerting, updated 2026-10-13, Alerting integrations, updated 2026-10-22, Nutanix Topology, updated 2026-05-04, and Resource Configuration Advisor, updated 2026-10-28.
Key points
- Reads Nutanix data from Prism Central or Prism Element through the REST API, with a View user role.
- Covers clusters, AHV hosts, VMs, storage pools, storage containers and disks.
- Samples every minute and collects every 20 minutes through the Prism Central REST API.
- Graphs capacity, host network throughput and memory usage.
- Alerts, VM-to-storage topology, configuration advisor, free open source license (GPL v3).
To compare XorMon with LogicMonitor for storage and Nutanix monitoring, read the LogicMonitor comparison.
Data sources and monitoring schemas
It gets data from one of these sources, you can select which oine you prefere, dataset is same:- Prism Central: single point for collecting data for all clusters
- Prism Element: data collected separately for each cluster
Last updated: