Trends
There ia also trends summary page under UI ➡ Settings ➡ Tools ➡ Trends.
It is single point of view for all clusters, nodes, server and VM where is presented
- CPU:
- Days to reach 70% capacity
- Days to reach 100% capacity
- CPU allocation
- Memory:
- Days to reach 70% capacity
- Days to reach 100% capacity
- Memory allocation
Examples
VMware cluster: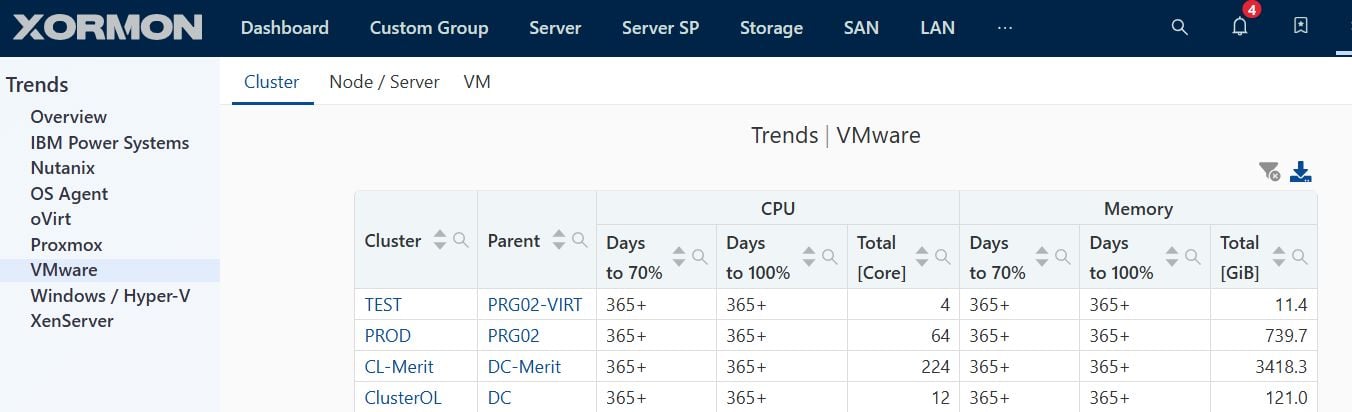 |
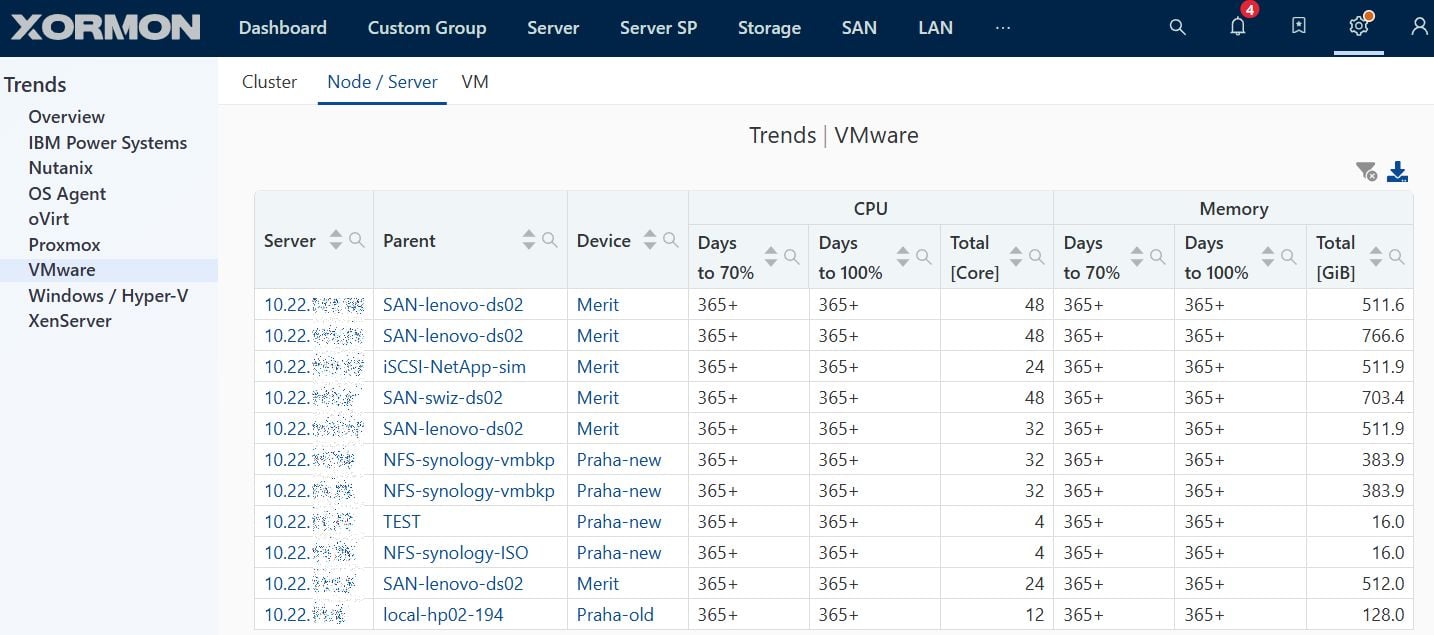
VMware ESXi:
 |
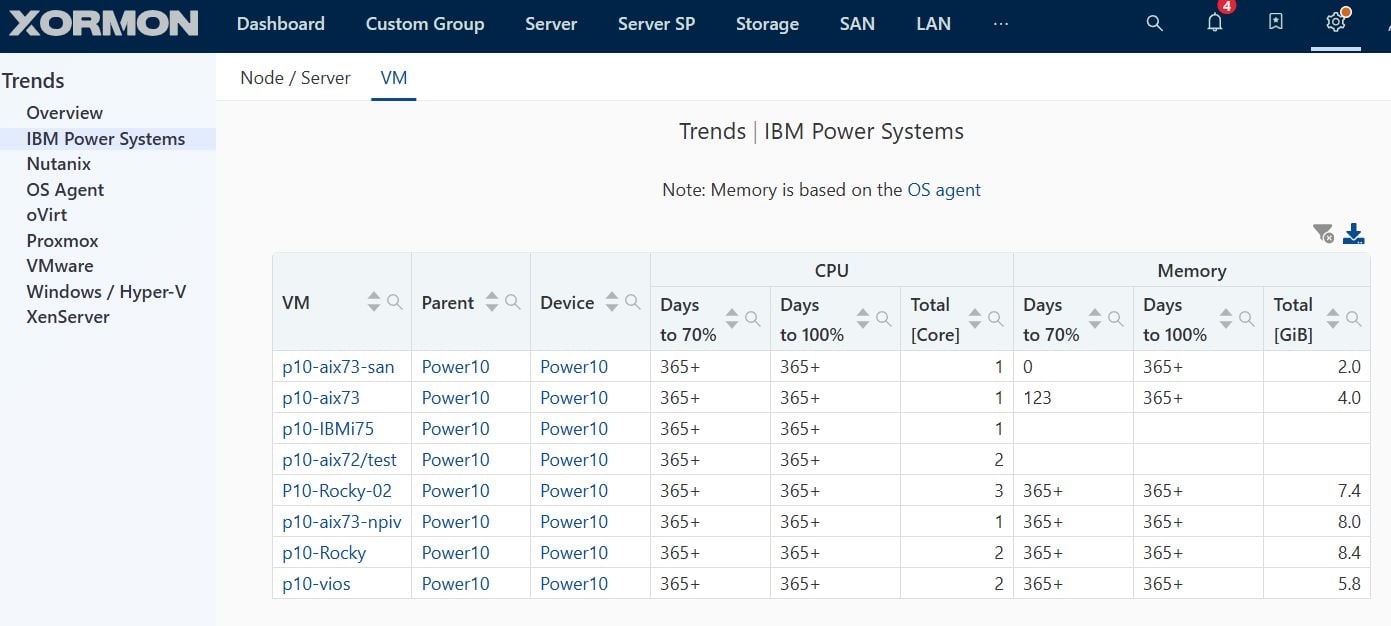
IBM Power Systems LPAR:
 |