Microsoft Azure Monitoring
Azure performance monitoring tracks how Microsoft Azure resources use CPU, disk, network and memory. XorMon, open source under GPL v3, monitors Azure virtual machines through the Azure REST API and graphs CPU %, data, IOPS and network, plus memory when the Azure Monitor Agent sends memory counters to a Log Analytics Workspace.
What is Azure performance monitoring?
Azure performance monitoring is the continuous tracking of the resource usage and performance of workloads running in Microsoft Azure, so that overloaded virtual machines are found before applications are affected.
XorMon documents Microsoft Azure next to other cloud technologies such as AWS, Google Cloud, IBM Cloud and KCU (Skytap), on the cloud installation page. For Azure, the supported service listed on this page and in the feature matrix is Virtual Machines.
Sources: Cloud installation, updated 2026-10-06, and Feature matrix.
Which Azure services and key metrics does XorMon monitor?
XorMon monitors Azure Virtual Machines and collects CPU %, data, IOPS, network (Net) and memory for each virtual machine; memory requires the Azure Monitor Agent.
Memory is not collected by default: a Data Collection Rule must send memory counters from the virtual machine, Windows or Linux, to a Log Analytics Workspace through the Azure Monitor Agent (AMA). On Windows, the counters are % Committed Bytes In Use, Available Bytes and Committed Bytes; on Linux, AvailableMemoryMB and UsedMemoryMB. The setup guide sets the sample rate to 60 seconds.
Sources: Azure memory monitoring, updated 2026-05-04, and Feature matrix.
How does XorMon collect Azure performance data?
XorMon reads Azure data through the Azure REST API, with the Monitoring Reader role, from XorMon to Azure on port 443. Azure data is sampled every minute and collected every 20 minutes.
The setup registers an application in Azure Active Directory, adds a client secret and assigns the Monitoring Reader role to this application on a resource group, in Access control (IAM). If the client secret has an expiration date, the process must be repeated. In the XorMon UI, under Settings, Device, Cloud, Azure, you enter a host alias, the Tenant ID, Client ID, Client Secret, resource name and Subscription ID, run the test, which must show OK, then wait about one hour before refreshing the browser.
Sources: Cloud installation, updated 2026-10-06, XorMon deployment, and Data frequency, updated 2026-05-04.
What does XorMon do with Azure performance data?
XorMon keeps cloud data for up to 3 years as daily averages, can alert on any metric it collects, and tracks configuration changes of Azure virtual machines.
For server, container and cloud data, retention is 1 month of 1 minute averages, 3 months of 5 minute averages, 6 months of 1 hour averages, 1 year of 6 hour averages and 3 years of daily averages, and retentions can be adjusted without data loss. The Change Tracker watches the disk size, instance size, location and operating system of Azure virtual machines and logs changes approximately every hour.
Sources: Data retention, updated 2026-05-04, Alerting, updated 2026-10-13, and Change Tracker, updated 2026-10-19.
Key points
- Monitors Azure Virtual Machines through the Azure REST API, with the Monitoring Reader role.
- Collects CPU %, data, IOPS and network per virtual machine, plus memory with the Azure Monitor Agent.
- Azure data is sampled every minute and collected every 20 minutes.
- Cloud data kept up to 3 years as daily averages; VM configuration changes logged about every hour.
- Alerts on any collected metric, free open source license (GPL v3).
Data source, services and metrics
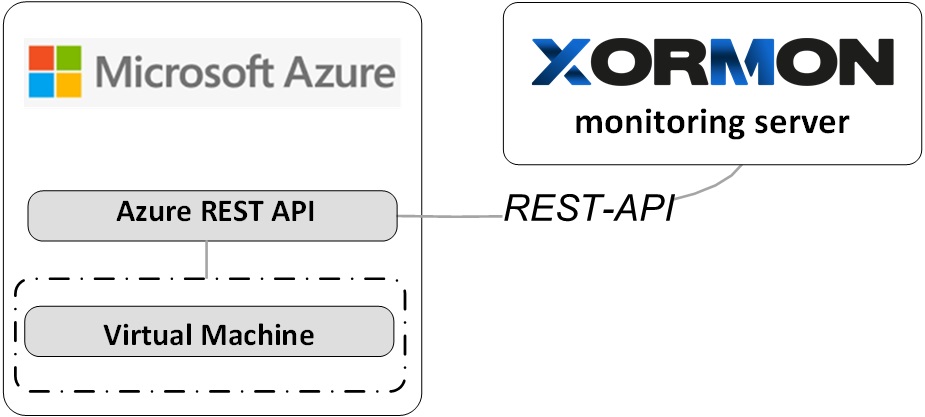 |
Data is collected via Azure REST API
Supported services
- Virtual Machines
Last updated: