Self Monitoring
xmtune.pl - PostgreSQL/TimescaleDB tuning helper for XorMon
Detects the machine's CPU count, RAM, and disk type, then recommends PostgreSQL settings.By default it assumes the DB shares the host with XorMon, so it tunes against ~2/3 of RAM (min 8GB) and half the CPUs(min 1 CPU).
Use --STANDALONE for a dedicated DB host.
USAGE
cd ~/xormon-ng
perl server-nest/scripts/dbtools/xmtune.pl [OPTIONS]
OPTIONS (case-insensitive)
--CONFIG_PATH=Path to postgresql.conf. Auto-detected if omitted. Not needed if both --CPU and --MEMORY are given. --CPU= Override CPU count. --MEMORY= [kBMBGB] Override total memory. Bare number = kB. --DISK_TYPE= SSD HDD SAN. Affects random_page_cost and effective_io_concurrency. --STANDALONE Dedicated DB host: full RAM and all CPUs, no reserve. --APPLY Write values into postgresql.conf (backup made first). --ALL With --JSON, list all params, not just changed ones. -- = Override any PG parameter, e.g. --shared_buffers=4GB. --HELP Show usage.
OUTPUT MODES
default   Prints a ready-to-run "psql -c ALTER SYSTEM SET ..." command for the changed parameters. Nothing is written.
--APPLY   Edits postgresql.conf in place (timestamped .bak backup first).
After applying, PostgreSQL needs a full restart.
EXAMPLES
perl server-nest/scripts/dbtools/xmtune.pl
perl server-nest/scripts/dbtools/xmtune.pl --shared_buffers=4GB --work_mem=64MB
perl server-nest/scripts/dbtools/xmtune.pl --CPU=16 --MEMORY=64GB --STANDALONE
perl server-nest/scripts/dbtools/xmtune.pl --CONFIG_PATH=/etc/postgresql/16/main/postgresql.conf --APPLY
Example output:
perl server-nest/scripts/dbtools/xmtune.pl --shared_buffers=4GB --work_mem=64MB
  Found PostgreSQL config at: /etc/postgresql/16/main/postgresql.conf
  Detected: 3 CPUs, 16009 MB RAM, HDD disk

  Run these commands as user postgres(or another superuser):
  After running these commands, you will need to restart your database to apply the changes!

  psql  -c "ALTER SYSTEM SET checkpoint_timeout = '300s';" -c "ALTER SYSTEM SET effective_cache_size = '12295148kB';"...
Tuning guidelines
max_connections -> 100 (fixed)
shared_buffers -> RAM ÷ 5 (20%)
effective_cache_size -> RAM × 3 ÷ 4 (75%)
maintenance_work_mem -> RAM ÷ 16, capped at 2 GB
work_mem -> (RAM − shared_buffers) ÷ ((max_connections + max_worker_processes) × 3), min 64 kB
wal_buffers -> -1 (let PostgreSQL auto-size)
min_wal_size -> 2 GB (XorMon workloads are write-heavy)
max_wal_size -> 4 GB
checkpoint_completion_target -> 0.9
checkpoint_timeout -> 300s
synchronous_commit -> off
random_page_cost -> HDD → 4, SSD → 1.1, SAN → 1.1
effective_io_concurrency -> HDD → 32, SSD → 200, SAN → 300
max_worker_processes -> 3 + timescaledb.max_background_workers + max_parallel_workers
max_parallel_workers ->  CPU count
max_parallel_workers_per_gather -> ceil(CPU ÷ 2), capped at 4
max_parallel_maintenance_workers -> ceil(CPU ÷ 2), capped at 4
timescaledb.max_background_workers -> max(20, CPU), capped at 32
 |
Navigate to UI ➡ Settings icon ➡ Help ➡ Self Monitoring
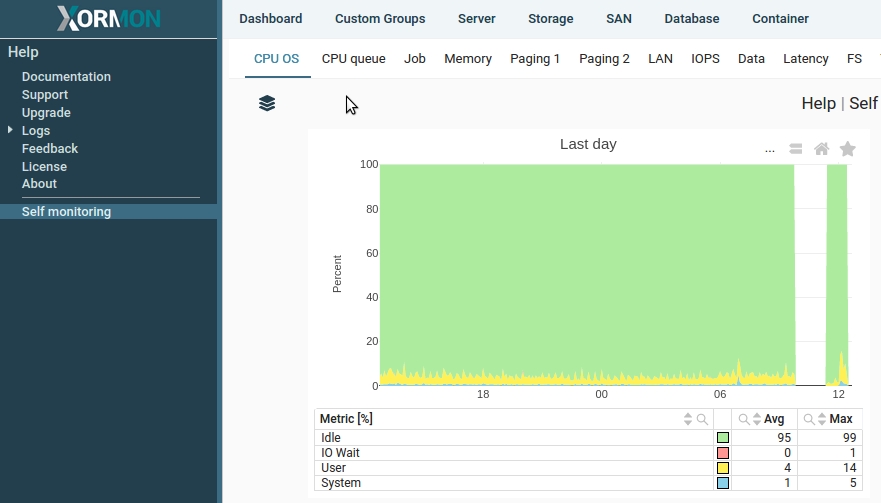
XorMon monitors the host via the standard Linux OS agent built into the XorMon server software.
The PostgreSQL database is also monitored via the standard PostgreSQL agent.
Overview
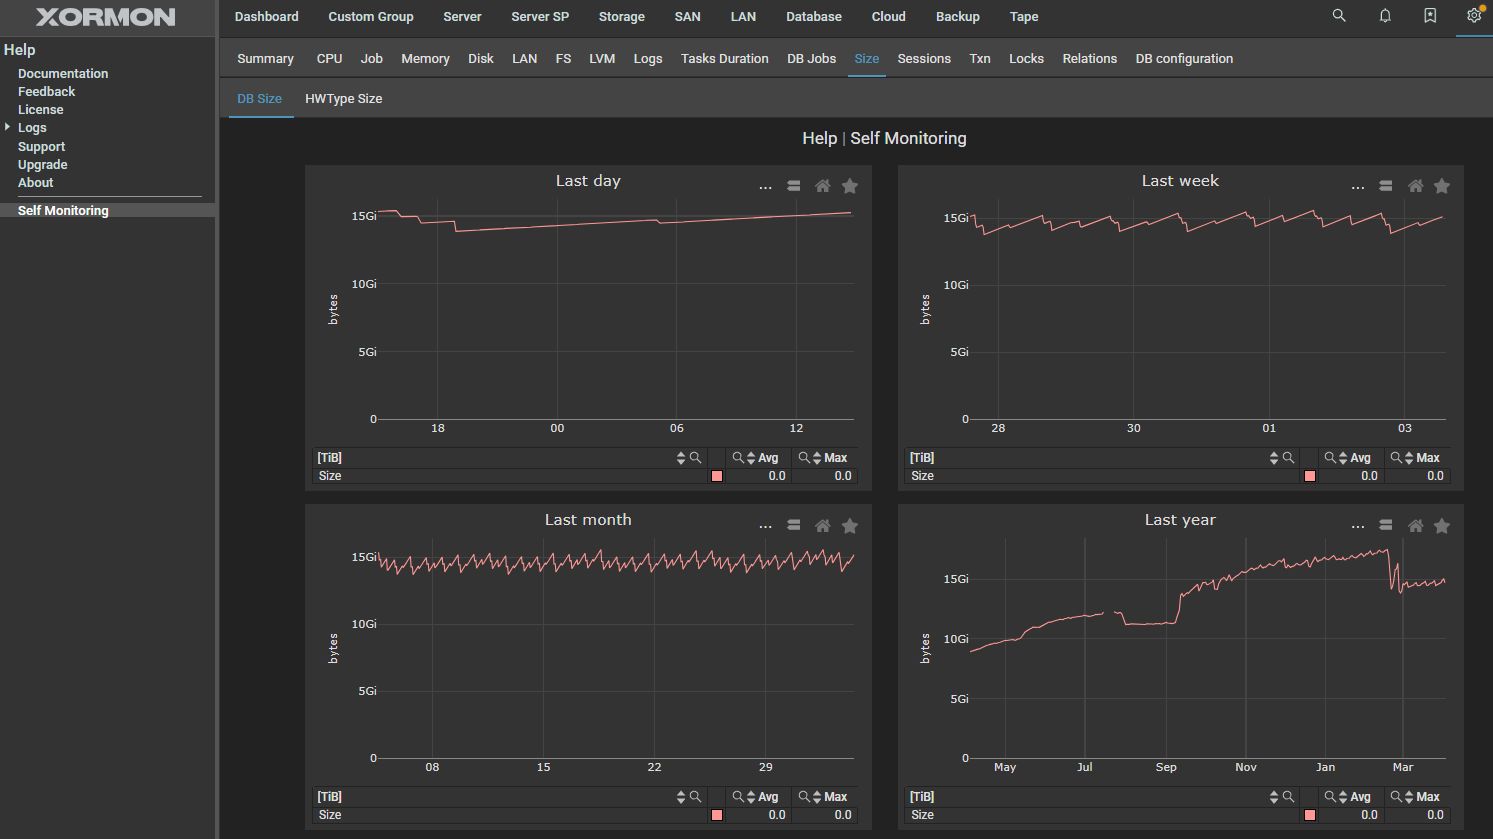
Database size
DB setup advisor
XorMon monitors the host via the standard Linux OS agent built into the XorMon server software.
The PostgreSQL database is also monitored via the standard PostgreSQL agent.
Overview
 |
Database size
 |
DB setup advisor
 |