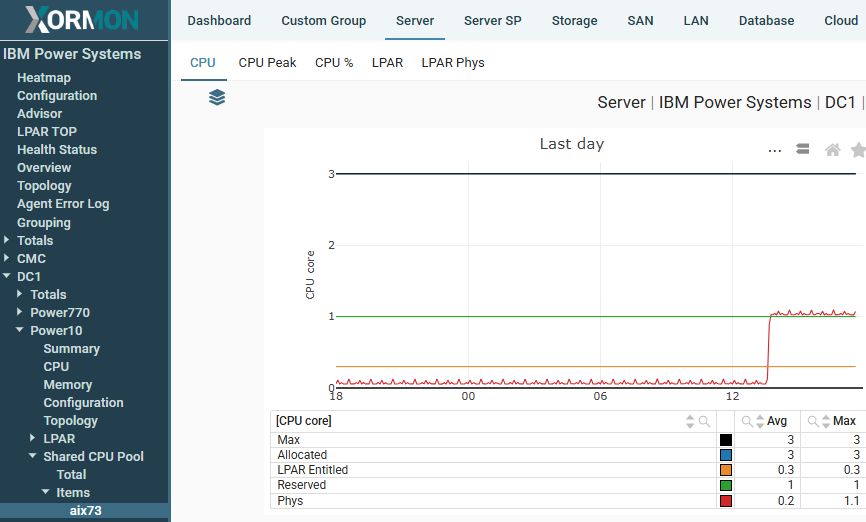
Explanation of metric visible in Shared CPU Pool graphs:
- Max: Maximum available for that CPU Pool, configuartion parametr of the Pool
- Allocated: number of CPUs which are available in the server for CPU Sharing purposes
- LPAR Entitled: Entitled CPU summary of all LPARs in that Pool
- Reserved: reserved CPU in the Pool configuration
- Phys: CPU Phys usage
Example where Max == Allocated, means there is CPU resources for Shared CPU Pools:
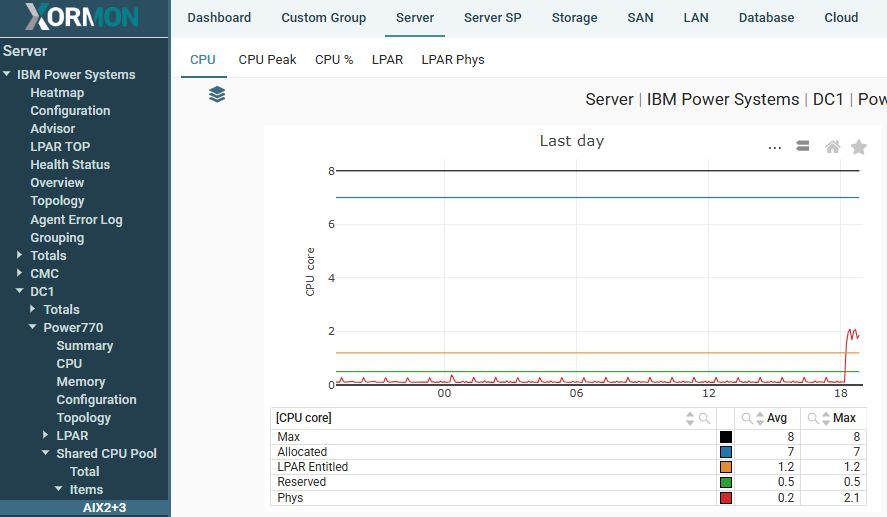
Example where Max > Allocated, means there is only 7 CPU available for Shared CPU Pools:
XorMon monitoring on LPAR, Server and Shared CPU Pool level these CPU metrics
- CPU Phys: CPU physical allocation to LPAR, it is what you can see in LPAR2RRD
- CPU Usage: real OS level CPU usage = "CPU physical" - "CPU idle cycles"
- CPU Virtual: number of virtual CPUs allocated for the LPAR
- CPU Entitled: entitled CPU allocated for the LPAR
LPAR in CPU dedicated mode
If a LPAR is in CPU dedicated mode with
keep idle procs then "CPU Phys" is equal "CPU Virtual" and it is a flat line in the graph.
Similary server "CPU Phys" contains
LPAR CPU dedicated example
You can see that "Phys", "Virtual" and "Entitled" are flat lines, 4 Cores
LPAR CPU dedicated: aggregated example
"CPU Phys" LPAR aggregated graph, you can see there same LPAR as above with 4 CPU cores
LPAR CPU dedicated: Server CPU Total
You can see that "Phys" is much higher than "Usage" due to a LPAR with 4 CPU dedicated in "keep idle procs" mode