PostgreSQL / EDB Monitoring
PostgreSQL monitoring with XorMon tracks the configuration, sessions, locks, wait events, vacuum and throughput of PostgreSQL and EDB databases. XorMon, open source under GPL v3, obtains data with SQL queries over ODBC, using a database user that has view only permissions, and graphs DB size, buffers, checkpoints, tuples, cursors, and cache hit and commit ratios.
Which PostgreSQL database metrics does XorMon monitor?
XorMon monitors 23 PostgreSQL metrics in 9 subsystems: configuration, background writer, throughput, sessions, locks, SQL query, wait events, vacuum and ratios.
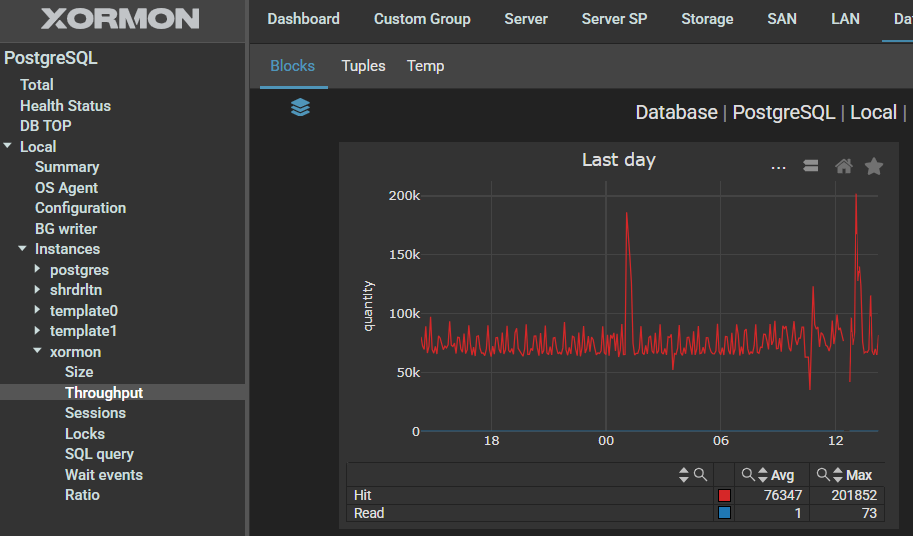
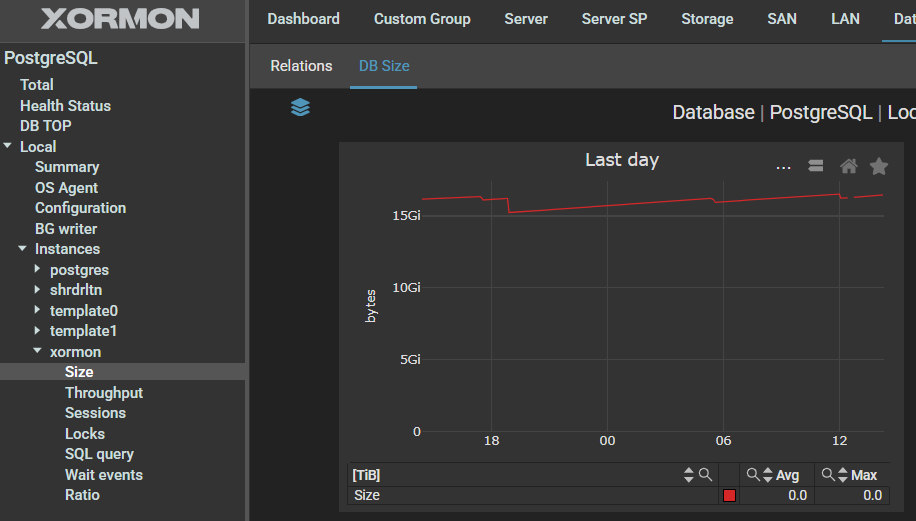
Configuration shows DB size, the background writer shows buffers and checkpoints, throughput is split into blocks, tuples and temp, and sessions into active, disabled, fastpath and idle. The ratios are cache hit and commit. PostgreSQL data is sampled and collected every 5 minutes.
Sources: Collected Metrics table below, updated 2026-11-10, Feature matrix, PostgreSQL tab, and Data frequency, updated 2026-05-04.
Does XorMon monitor PostgreSQL vacuum and SQL queries?
Yes. XorMon graphs the vacuum phase and two SQL query metrics, user and cursors, next to locks held, locks awaited and deadlocks.
Wait events cover four types, among them Lock and BufferPin. The feature matrix lists no other vacuum or SQL query metric for PostgreSQL. Any metric that XorMon collects can be selected for alerting.
Sources: Feature matrix, PostgreSQL tab, and Alerting, updated 2026-10-13.
Does XorMon monitor EDB as well as PostgreSQL?
Yes. XorMon monitors PostgreSQL and EDB databases the same way, through SQL protocol, with a read-only database user.
The database installation guide has one PostgreSQL / EDB section, and the XorMon deployment table lists EDB and PostgreSQL with the same interface and user role. PostgreSQL gives XorMon information about every database on the host machine.
Sources: Database installation, updated 2026-10-06, and XorMon deployment.
Does XorMon monitor PostgreSQL on IBM Power Systems?
Yes. PostgreSQL monitoring in XorMon is platform independent: XorMon connects to the database over the network with SQL queries, whether PostgreSQL runs on AIX, Linux on Power or any other platform.
PostgreSQL gives XorMon information about every database on the host machine. On IBM Power Systems servers, XorMon also collects data through the HMC REST API for AIX, IBM i, VIOS and Linux on Power LPARs.
Sources: Database installation, updated 2026-10-06, and IBM Power Systems monitoring, updated 2026-11-07.
Key points
- Monitors PostgreSQL and EDB databases through SQL protocol, with a database user that has view only permissions.
- 23 metrics in 9 subsystems, from DB size, sessions and locks to wait events, vacuum phase and cache hit ratio.
- PostgreSQL data sampled and collected every 5 minutes.
- Platform independent: monitors PostgreSQL on AIX, Linux on Power or any other platform.
- Alerts on any collected metric, free open source license (GPL v3).
PostgreSQL monitoring setup and metrics
 |
XorMon obtains data through SQL protocol.
XorMon requires a database user (typically "xormon") with the view only permissions to collect monitoring data
Collected Metrics
| Subsystem | Metric | Database |
|---|---|---|
| Configuration | DB size | yes |
| Main | yes | |
| BG writer | Buffers | yes |
| Checkpoints | yes | |
| Throughput | Blocks | yes |
| Tuples | yes | |
| Temp | yes | |
| Sessions | Active | yes |
| Disabled | yes | |
| Fastpath | yes | |
| Idle | yes | |
| Locks | Held | yes |
| Awaited | yes | |
| Deadlocks | yes | |
| SQL query | User | yes |
| Cursors | yes | |
| Wait events | LWLockNamed | yes |
| LWLLockTranche | yes | |
| Lock | yes | |
| BufferPin | yes | |
| Vacuum | Phase | yes |
| Ratio | Cache hit | yes |
| Commit | yes |
Examples
Summary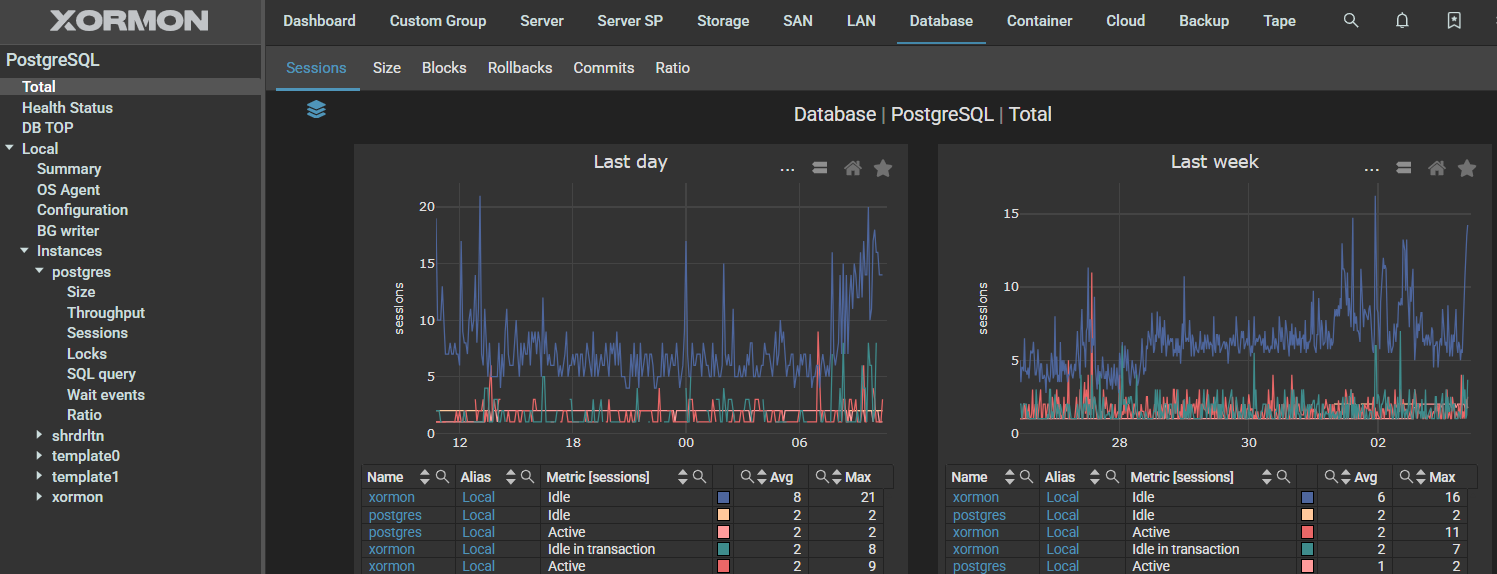 |
Throughput
 |
DB size
 |
Last updated: