IBM Db2 Monitoring
IBM Db2 monitoring with XorMon tracks the health, configuration and performance of Db2 databases, with performance metrics per database and per member. XorMon, open source under GPL v3, collects data through the Perl module DBD::DB2 and graphs agents, locks, IO, latency, sessions, rows, network, SQL query, waits and ratios such as buffer hit.
What does IBM Db2 monitoring cover in XorMon?
XorMon monitors IBM Db2 per database and per member: the database has a health status and a configuration view (main, size and members), and both levels get the same 38 performance metrics.
The Collected Metrics table below groups these 38 metrics into 10 subsystems: Agents, Locks, IO, Latency, Session, Rows, Network, SQL query, Waits and Ratio. The feature matrix has an IBM Db2 tab with the same table, next to Oracle, Microsoft SQL Server, MongoDB and PostgreSQL. The health status dashboard covers all supported technologies, and each technology also has its own local health status with additional details.
Sources: Feature matrix, and Health status, updated 2026-05-04.
Which IBM Db2 performance metrics does XorMon collect?
XorMon collects agent, lock, IO, latency, session, row, network, SQL query and wait metrics, plus buffer hit, CPU time and log hit ratios, for each database and each member.
Agents covers agents max and pooled, associated, coordinated, registered, idle and stolen agents. Locks covers locks held and waiting, escalations, timeouts and deadlocks. IO is split into logical, physical and direct, and latency into direct, pool and log. Session shows max connections, connections and secondary connections per second, and current connections. Rows has total, internal and network values, and Network has remote, local and FCM. SQL query shows cache inserts, cache lookups, commits and rollbacks, and Waits shows total, IO and network waits.
Source: Feature matrix, IBM Db2 tab.
How does the XorMon Db2 monitoring tool collect data?
XorMon connects to each Db2 database through the Perl module DBD::DB2, with a database user that has Connect, Execute on the SYSPROC functions and procedures, and Select on the SYSIBMADM.DB2_MEMBER table.
The installation guide creates this user on each database on the host machine. Outside the XorMon Virtual Appliance, the Perl DBI and DBD::DB2 modules are installed first, from an IBM data server driver package. Each database is then added in the XorMon UI under Device, Database, IBM Db2, New, and Test must show OK. After about 1 hour, refresh the browser cache with Ctrl-F5.
Source: Database installation, updated 2026-10-06.
How does XorMon store IBM Db2 data and alert on it?
IBM Db2 data is sampled and collected every 5 minutes, kept as 5 minute averages for 3 months and as daily averages for 3 years, and any collected metric can be used for alerting.
Database data is also kept as 1 hour averages for 6 months and 6 hour averages for 1 year, and retentions can be adjusted without data loss. Performance alerts are configured under Settings, Alerting, Performance, with a threshold and email groups defined in advance. Event alerting sends an alert when a device turns red in the global health status dashboard, and a clear alert when it turns green again. Alerts can go out by email, SNMP trap, ServiceNow, Zabbix, Discord or Telegram. IBM Db2 members can be grouped in a custom group, and the public API lists database_db2 among its CMDB types.
Sources: Data frequency, Data retention, Custom groups and CMDB CSV export, all updated 2026-05-04, Alerting, updated 2026-10-13, and Alerting integrations, updated 2026-10-22.
Key points
- Monitors IBM Db2 per database and per member, through the Perl module DBD::DB2.
- 38 performance metrics in 10 subsystems, from agents and locks to SQL query, waits and ratios.
- Health status and configuration (main, size, members) at database level.
- 5 minute sample rate and data collection, 5 minute averages kept 3 months, daily averages 3 years.
- Alerts on any collected metric, free open source license (GPL v3).
IBM Db2 monitoring setup and metrics
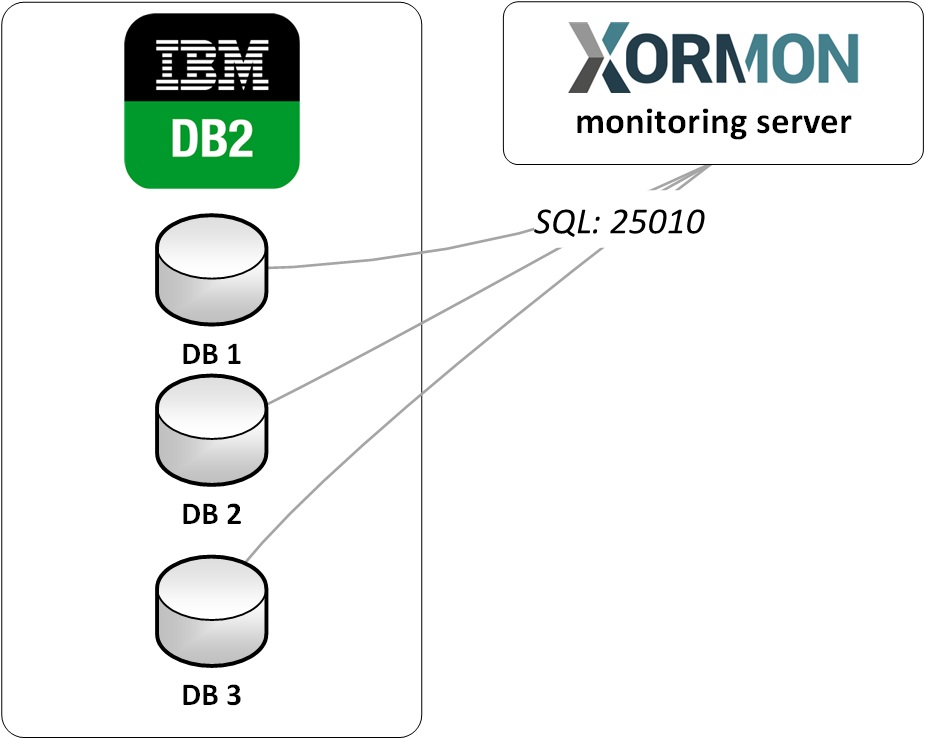 |
XorMon obtains data through Perl module DBD::DB2.
XorMon requires a database user with the following permissions to collect monitoring data:
- Connect
- Execute on SYSPROC.* functions and procedures
- Select on table SYSIBMADM.DB2_MEMBER
Collected Metrics
| Subsystem | Metric | Database | Member |
|---|---|---|---|
| Health Status | yes | ||
| Configuration | Main | yes | |
| Size | yes | ||
| Members | yes | ||
| Agents | Agents max | yes | yes |
| Pooled | yes | yes | |
| Associated | yes | yes | |
| Coordinated | yes | yes | |
| Registered | yes | yes | |
| Idle | yes | yes | |
| Stolen | yes | yes | |
| Locks | Held | yes | yes |
| Waiting | yes | yes | |
| Escals | yes | yes | |
| Timeouts | yes | yes | |
| Deadlocks | yes | yes | |
| IO | Logical | yes | yes |
| Physical | yes | yes | |
| Direct | yes | yes | |
| Latency | Direct | yes | yes |
| Pool | yes | yes | |
| Log | yes | yes | |
| Session | Max conns | yes | yes |
| Conns/s | yes | yes | |
| Secondary conns/s | yes | yes | |
| Current conns | yes | yes | |
| Rows | Total | yes | yes |
| Internal | yes | yes | |
| Network | yes | yes | |
| Network | Remote | yes | yes |
| Local | yes | yes | |
| FCM | yes | yes | |
| SQL query | Cache inserts | yes | yes |
| Cache lookups | yes | yes | |
| Commits | yes | yes | |
| Rollbacks | yes | yes | |
| Waits | Total | yes | yes |
| IO | yes | yes | |
| Network | yes | yes | |
| Ratio | Buffer hit | yes | yes |
| CPU time | yes | yes | |
| Log hit | yes | yes |
Last updated: