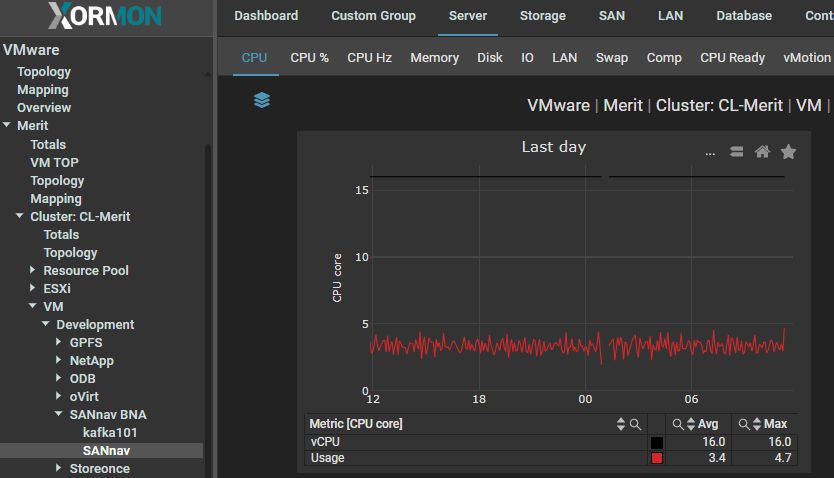
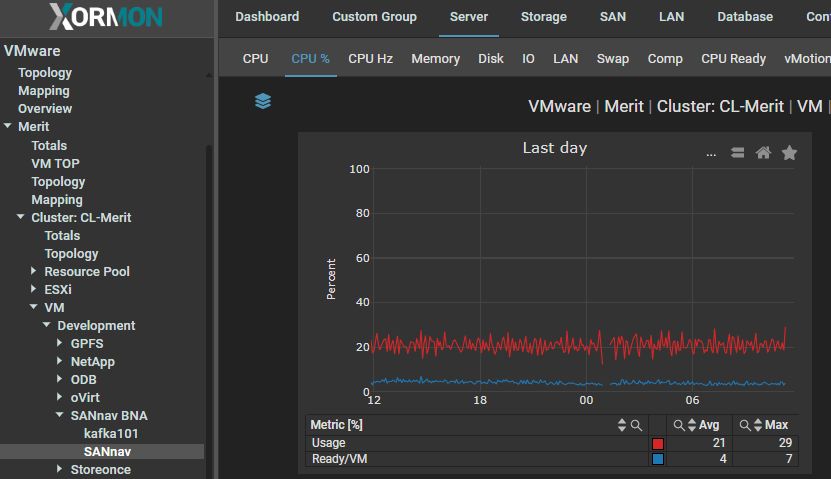
VMware CPU monitoring
- CPU usage in CPU core
- CPU usage in %
- CPU usage in GHz
CPU core
 |
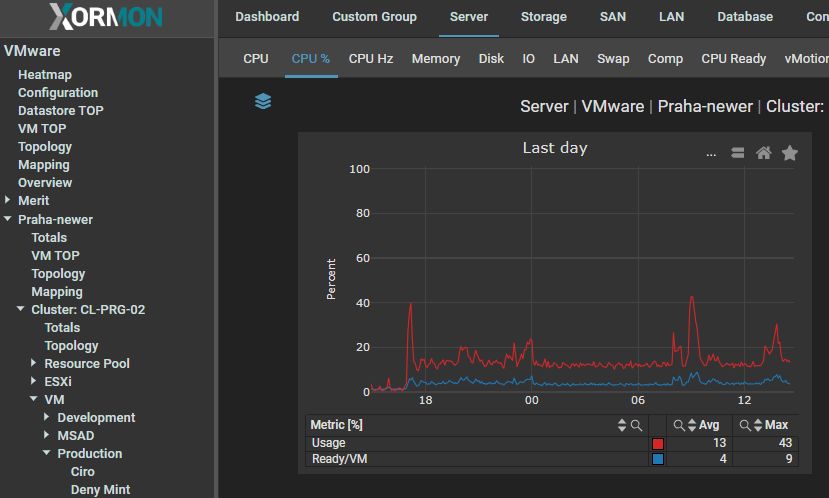
CPU %
 |
CPU GHz
 |
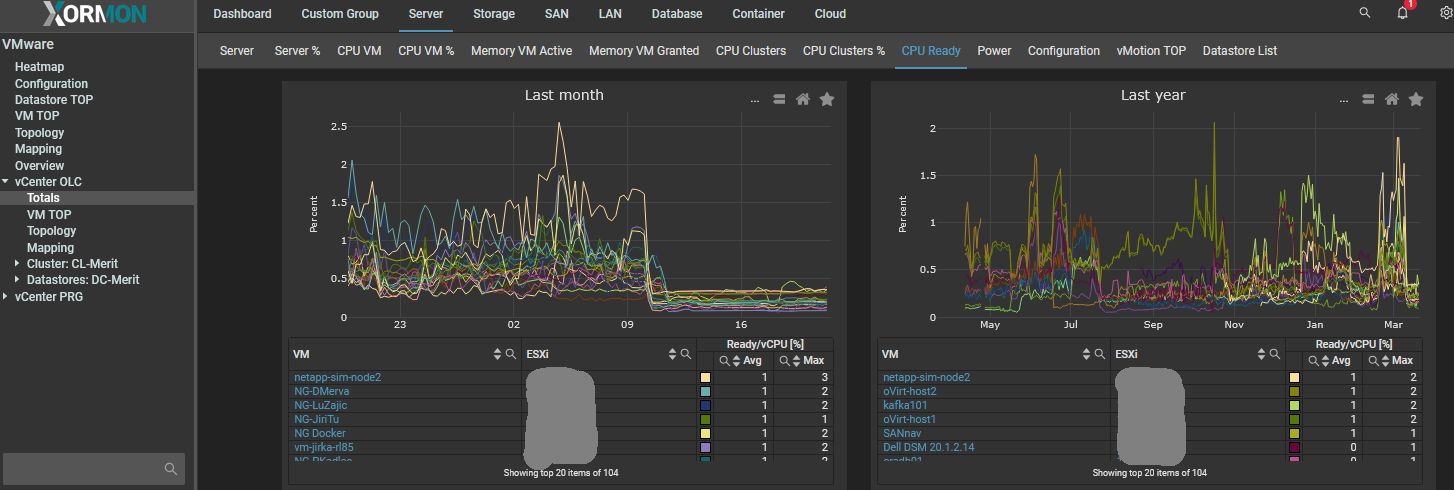
CPU Ready
CPU Ready time is a more complex metric that often has different causes and could heavily impact the performance of your VMs. The metric is a percentage of time during which the virtual machine is ready but cannot get scheduled to run on physical CPU. In ESXTOP (ESXTOP is a command-line tool that provides real-time resource usage on a vSphere ESXi host) this metric is called “%RDY”, while in the vSphere Client it’s called “Readiness” – not to be confused with “CPU Ready”, which shows the summation in ms, instead of the percentage. You can calculate the percentage from the summation in ms using the following formula:(CPU summation value / (A ready time percentage of <5% is typically not an issue and should not cause significant performance impact. However, if the metric reaches above 10% the impact will become quite significant. I’ll be going over the two most common causes of the ready time and how you can identify and solve these issues.* 1000)) * 100 = CPU ready %
-
"CPU Ready" graph for VM has legend "CPU Ready/vCPU"
It means it is CPU Ready per vCPU, so it is total CPU Ready for whole VM (it is sum of CPU Ready of all vCPU cores) divided by number of vCPU.
VMWare recommends CPU Ready to be under 5%.

- "VM CPU" graph with CPU ready
It has legend CPU Ready/VM so it is total CPU Ready for whole VM (actually it is sum of CPU Ready of all vCPU cores).
This graph is prepared so it looks like the same graph in vCenter vShere in new (8.) version.
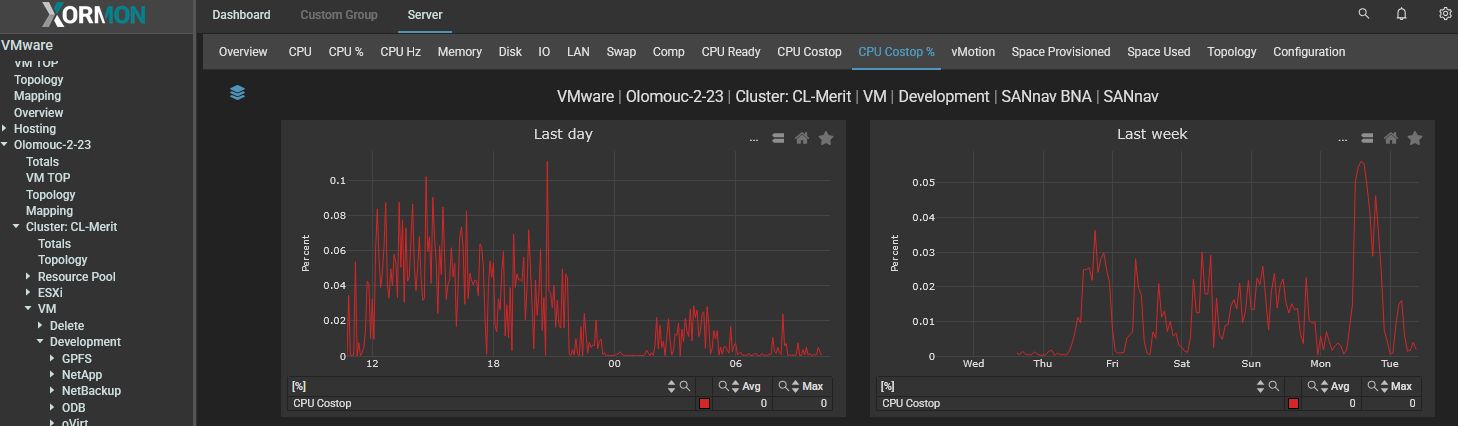
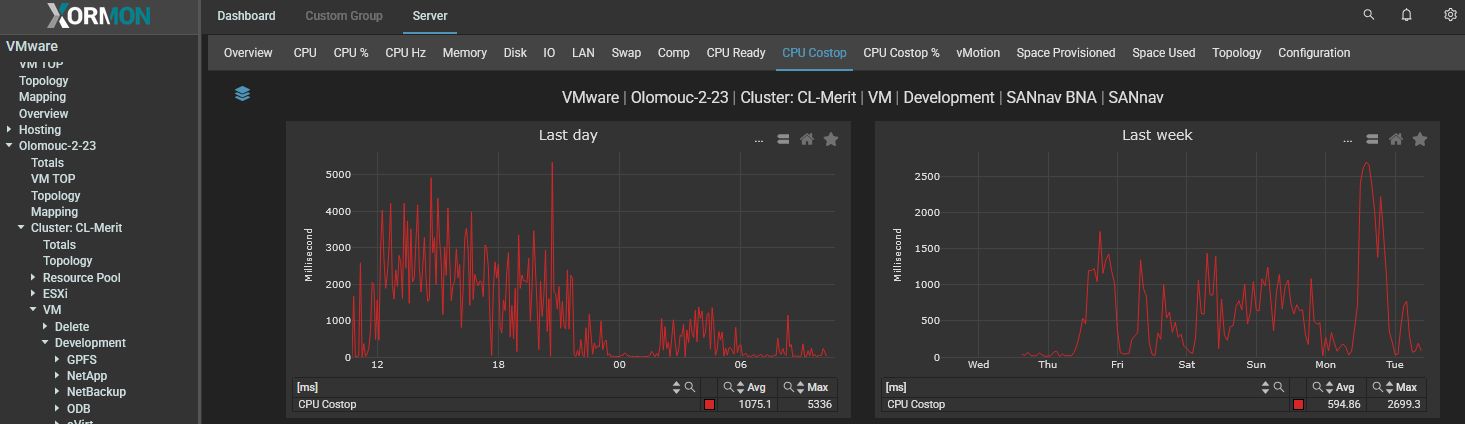
CPU Co-Stop
Co-Stop indicates a percentage of time a vSMP (Virtual Symmetric Multi-Processing) virtual machine was ready to run but incurred delay due to co-vCPU scheduling contention (100% = %RUN + %RDY + %CSTP + %WAIT). This metric applies to all VMs that have >1 vCPU allocated, and it basically means that the physical processors do not have sufficient CPU scheduling opportunities. Depending on the situation, there could be multiple ways to resolve this.First you need to identify if there are multiple VMs that have this issue or if only a few big ones have this problem. For example, there could be one or more big VMs that have so many vCPUs assigned compared to the number of physical cores of the host that it would be difficult to schedule all its vCPUs at the exact same time. This could be solved by lowering the number of vCPUs allocated to these VMs or by moving them to a host with more physical cores per processor.
On the other hand, it could be that (almost) all your VMs are seeing Co-Stop time. This could indicate that your CPU overprovisioning factor is too high, which would lead to the same issue. You can calculate your overprovisioning factor by dividing the number of allocated vCPUs by the number of physical cores you have in the platform/host. In general, an overprovisioning factor of 3:1 should not cause any issues. However, going over that can start to cause performance degradation and going above 5:1 is highly likely to cause significant impact.
-
"CPU Co-Stop" graph for VM in miliseconds
-
"CPU Co-Stop" graph for VM in %