RHV / oVirt / OLVM Monitoring
RHV monitoring tracks the performance of Red Hat Virtualization clusters, hosts, virtual machines and storage domains. XorMon, open source under GPL v3, monitors RHV, oVirt and OLVM without an agent. It reads the ovirt_engine_history database of the Virtualization Manager and graphs CPU, memory, LAN throughput, storage space, storage throughput, IOPS and latency.
Which tool monitors Red Hat Virtualization, oVirt and OLVM?
XorMon monitors Red Hat Virtualization (RHV, formerly RHEV), oVirt and Oracle Linux Virtualization Manager (OLVM), listed under the KVM hypervisor, with one agentless implementation for all three.
The monitored components are clusters, hosts, VMs and storage domains. The data source is the Red Hat Virtualization Manager for RHV and the Oracle Linux Virtualization Manager for OLVM. The Resource Configuration Advisor supports oVirt, RHV and OLVM: once a day after midnight, it collects average and peak CPU, memory and IO utilization of VMs for the last day, week and month and suggests resource changes, and the administrator decides what to apply.
Sources: Hypervisor monitoring, updated 2026-10-06, and Resource Configuration Advisor, updated 2026-10-28.
Which RHV performance metrics does XorMon collect?
XorMon graphs CPU, memory utilization, LAN throughput in MB/sec, storage space in GB, storage throughput in MB/sec and in IOPS, and storage latency.
The collected data set can be enhanced with the Linux OS agent; under RHV, oVirt and OLVM, its data is mapped to the virtual machine. The agent brings CPU user, sys and IO wait, load average and blocked processes, used memory and FS cache, paging rate and paging space usage, FC and Ethernet adapter throughput, filesystem usage, SAN multipath and CPU and memory tracking of running processes with JOB TOP. Server data is kept as 1 minute averages for 1 month, 5 minute averages for 3 months, 1 hour averages for 6 months, 6 hour averages for 1 year and daily averages for 3 years, and retentions can be adjusted without data loss.
Sources: Linux monitoring, updated 2026-10-21, and Data retention, updated 2026-05-04.
How does XorMon collect RHV data without an agent?
XorMon reads the ovirt_engine_history database of the oVirt or RHV Virtualization Manager over port 5432; the implementation is agentless. The Virtualization Manager REST API is an optional additional source.
This database is part of the Data Warehouse and contains only historical performance data. The XorMon server needs the perl-DBI and perl-DBD-Pg modules, except on the Virtual Appliance. By default, only an administrator account is available in ovirt_engine_history, with a randomly generated password on each Virtualization Manager; a read-only user such as xormon_ro can be created directly in the database, with SELECT rights on the public schema tables and an entry in pg_hba.conf for the XorMon IP address.
Source: RHV installation, updated 2026-08-18.
What does the optional RHV REST API connection add?
The Virtualization Manager REST API adds host and VM NIC graphs, active VM counts, VM and disk configuration properties, and the storage topology of oVirt VMs and storage domains.
NIC graphs show receive and transmit utilization in % and dropped packets per second, and the active VM count is aggregated per host in the cluster and datacenter totals. The REST API client collects volume WWIDs of storage domains and direct-LUN WWIDs of VMs, which the DWH does not expose, and maps them to storage arrays via WWN for the VM to Storage and Storage Domain to Storage topology views. The REST API user, for example xormon@internalsso, is created in the Keycloak SSO bundled with oVirt 4.5.1 and later and gets a custom read-only admin role. XorMon alerting can be set on any metric the tool collects.
Sources: RHV REST API, updated 2026-10-13, RHV Topology, updated 2026-08-11, RHV installation, updated 2026-08-18, and Alerting, updated 2026-10-13.
Key points
- Monitors Red Hat Virtualization (RHV), oVirt and OLVM clusters, hosts, VMs and storage domains.
- Agentless: reads the ovirt_engine_history database of the Virtualization Manager over port 5432.
- Graphs CPU, memory, LAN throughput, storage space, storage throughput, IOPS and storage latency.
- The optional REST API adds NIC graphs, VM counts, configuration properties and storage topology.
- Linux OS agent data mapped to VMs, Resource Configuration Advisor, alerts on any collected metric, free open source license (GPL v3).
Monitored components, metrics and OS agent data
Implementation is agent less.Data source is ovirt_engine_history database which is part of Data Warehouse on oVirt/RHV (RHV, formerly RHEV) Virtualization Manager.
Tool accesses the ovirt_engine_history database remotely via its SQL API.
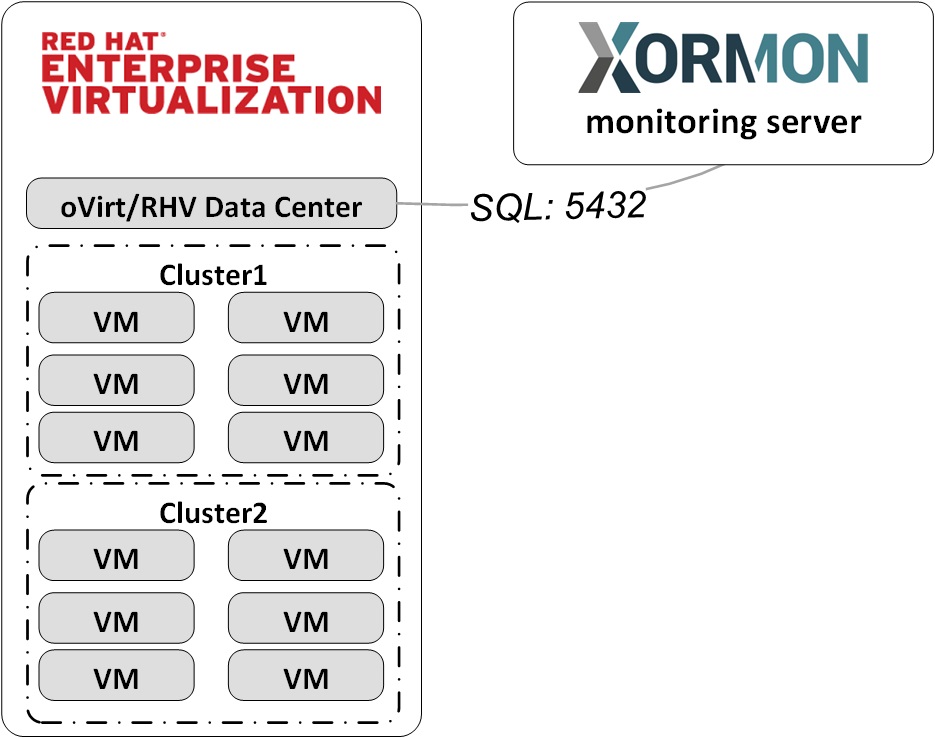
Monitored components
- Cluster
- Host
- VM
- Storage Domain
Monitored metrics
- CPU
- Memory utilization
- LAN throughput MB/sec
- Storage space GB
- Storage throughput MB/sec
- Storage throughput IOPS
- Storage latency
Collected data set can be enhanced about OS agent which brings these additional metrics:
| OS CPU | CPU sys, user, IO wait |
| CPU queue | Load avrg, Blocked processes |
| JOB | CPU, Memory |
| Memory utilization | Used, FS cache |
| LAN (ethernet adapters) | MB/sec, packet count |
| SAN (FC,vSCSI adapters) | MB/sec, packets/sec, Latency |
| Paging space utilization | Usage in % |
| Paging rate | MB/sec |
| Filesystem usage | Usage in %, GB |
| Error log | errpt |
| LVM | filesystem, VG, LV, disk, storage, volume |
| Disk multipath | disk |
Last updated: