You can easilly integrate XorMon into Grafana.
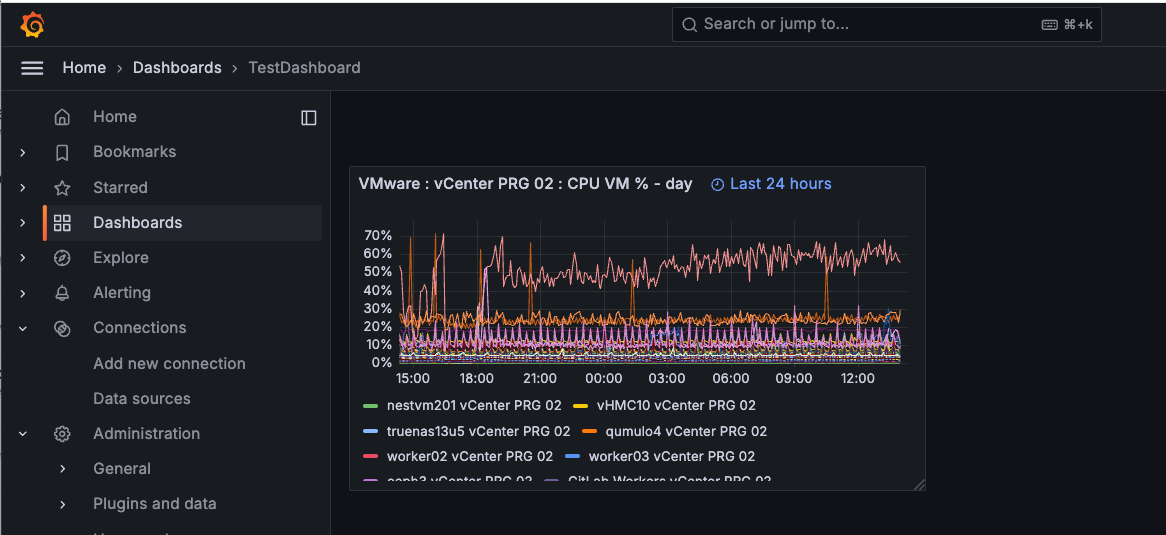
You can select whatever graph or complete user dashboard and push it into Grafana into your selected structure.
Grafana intergration requires a XorMon REST API license.
Either use it in the initial 3 months trial period or ask for the trial license via
trial form.
Newer method via
Grafana XorMon plug-in allows for the creation of custom charts, not just the import of predefined ones.
All is managed though Grafana, graph, table selection, no need to do anything on the Xormon side in compare to method without plug-in.
Examples
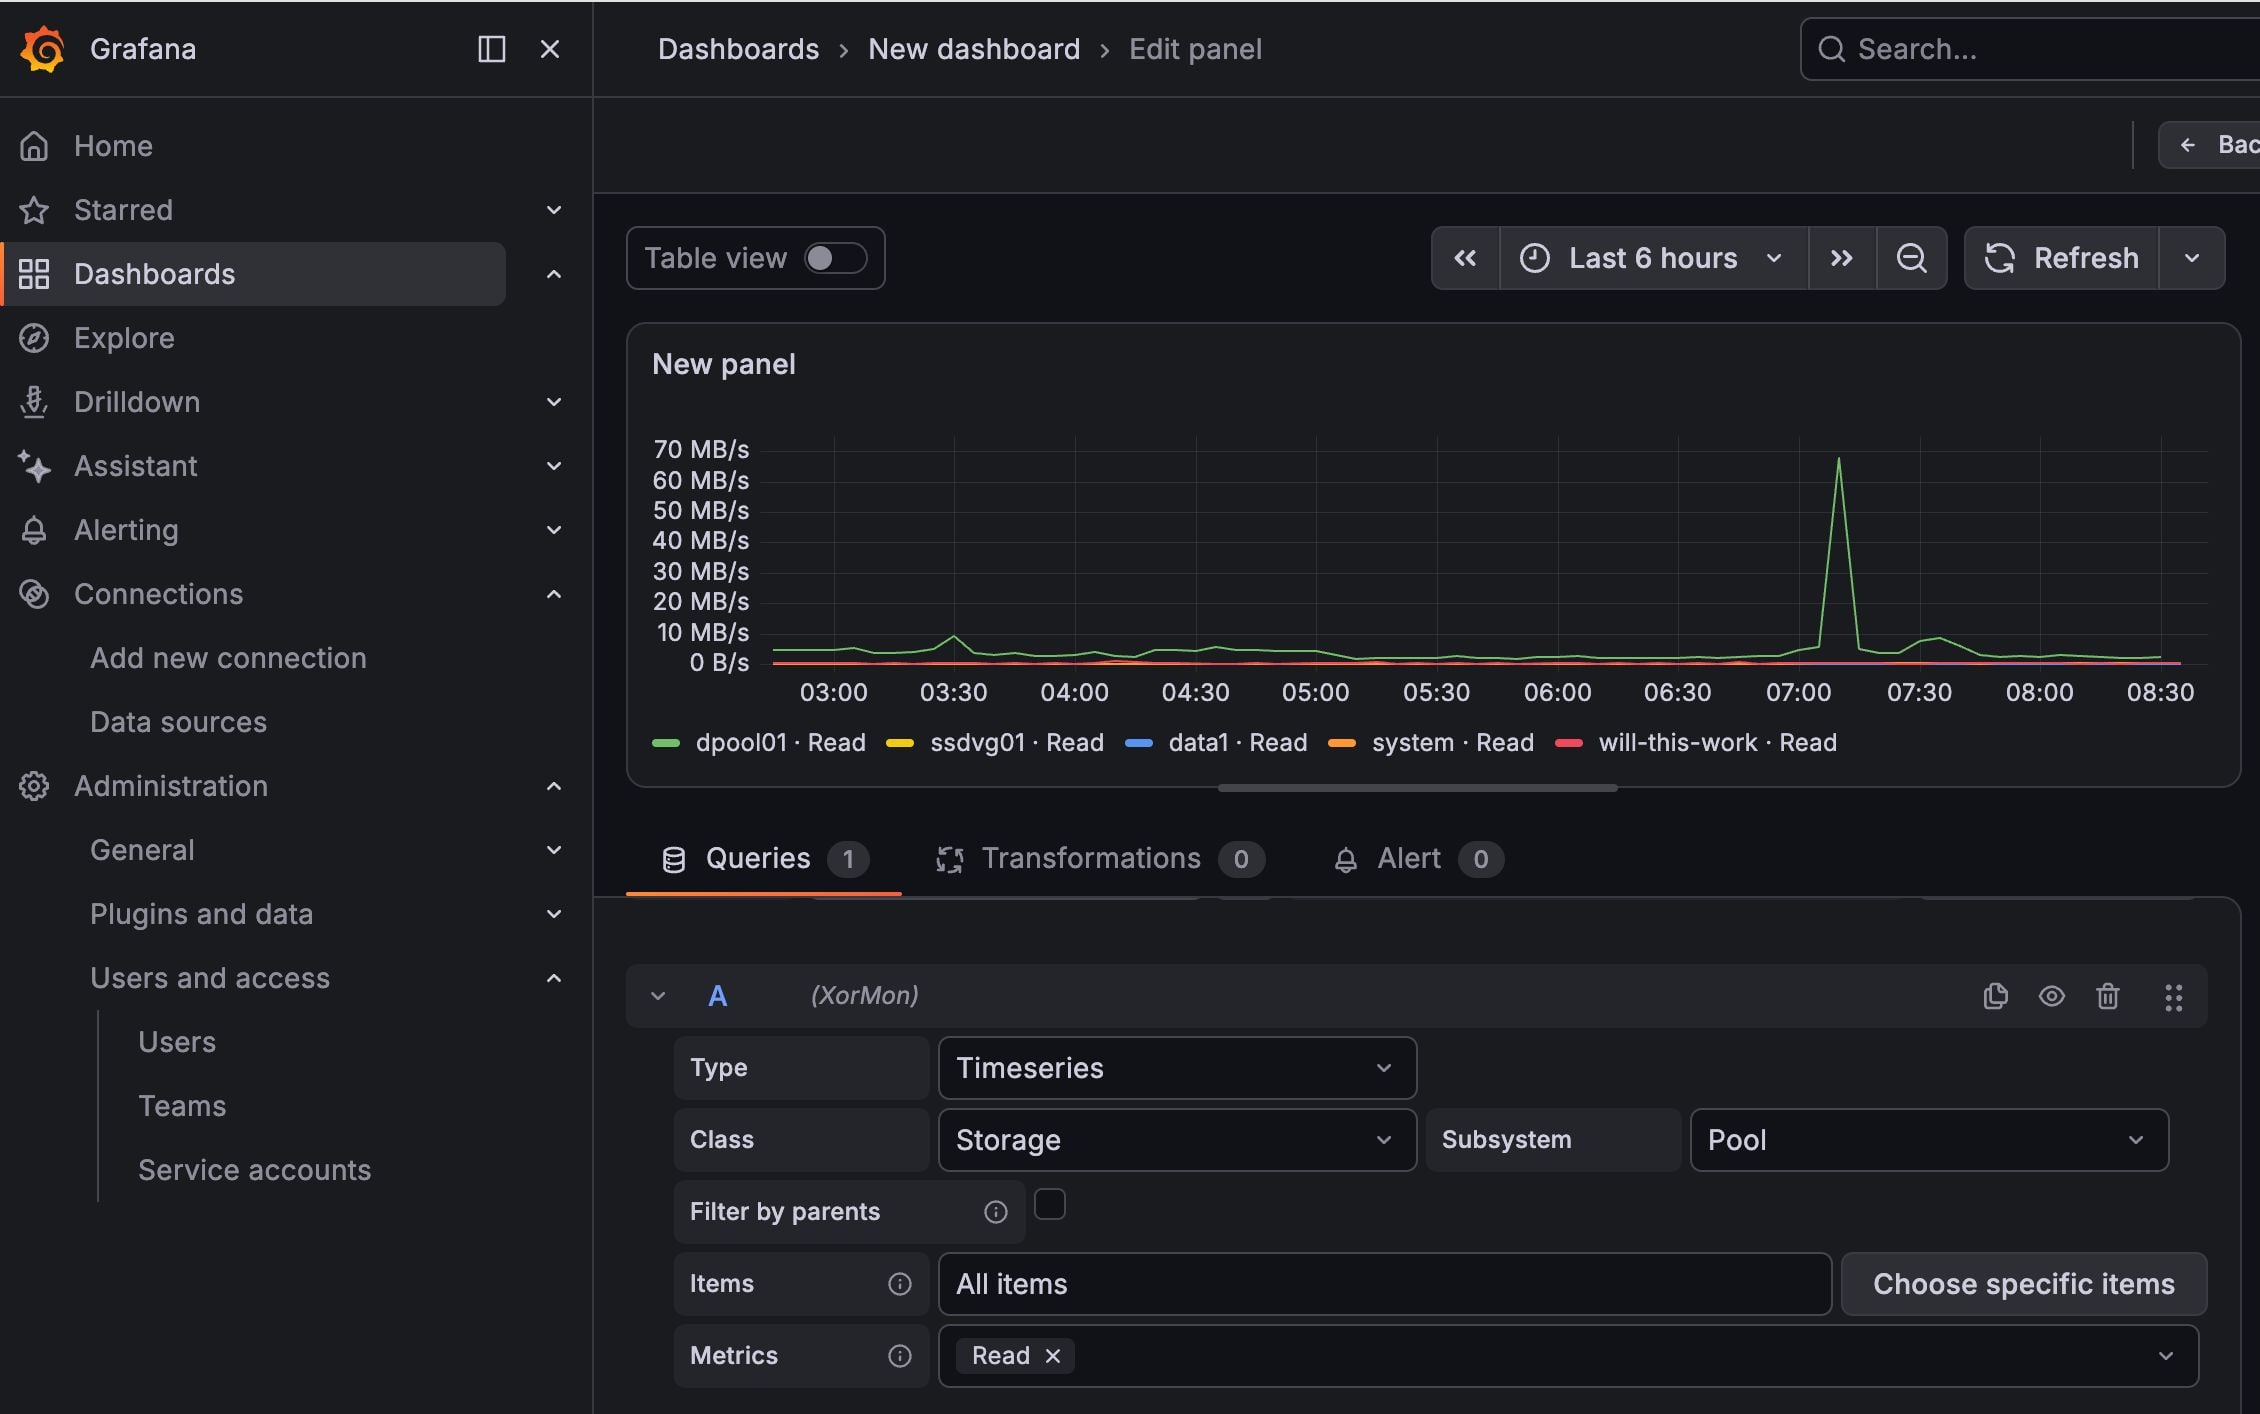
Graph:
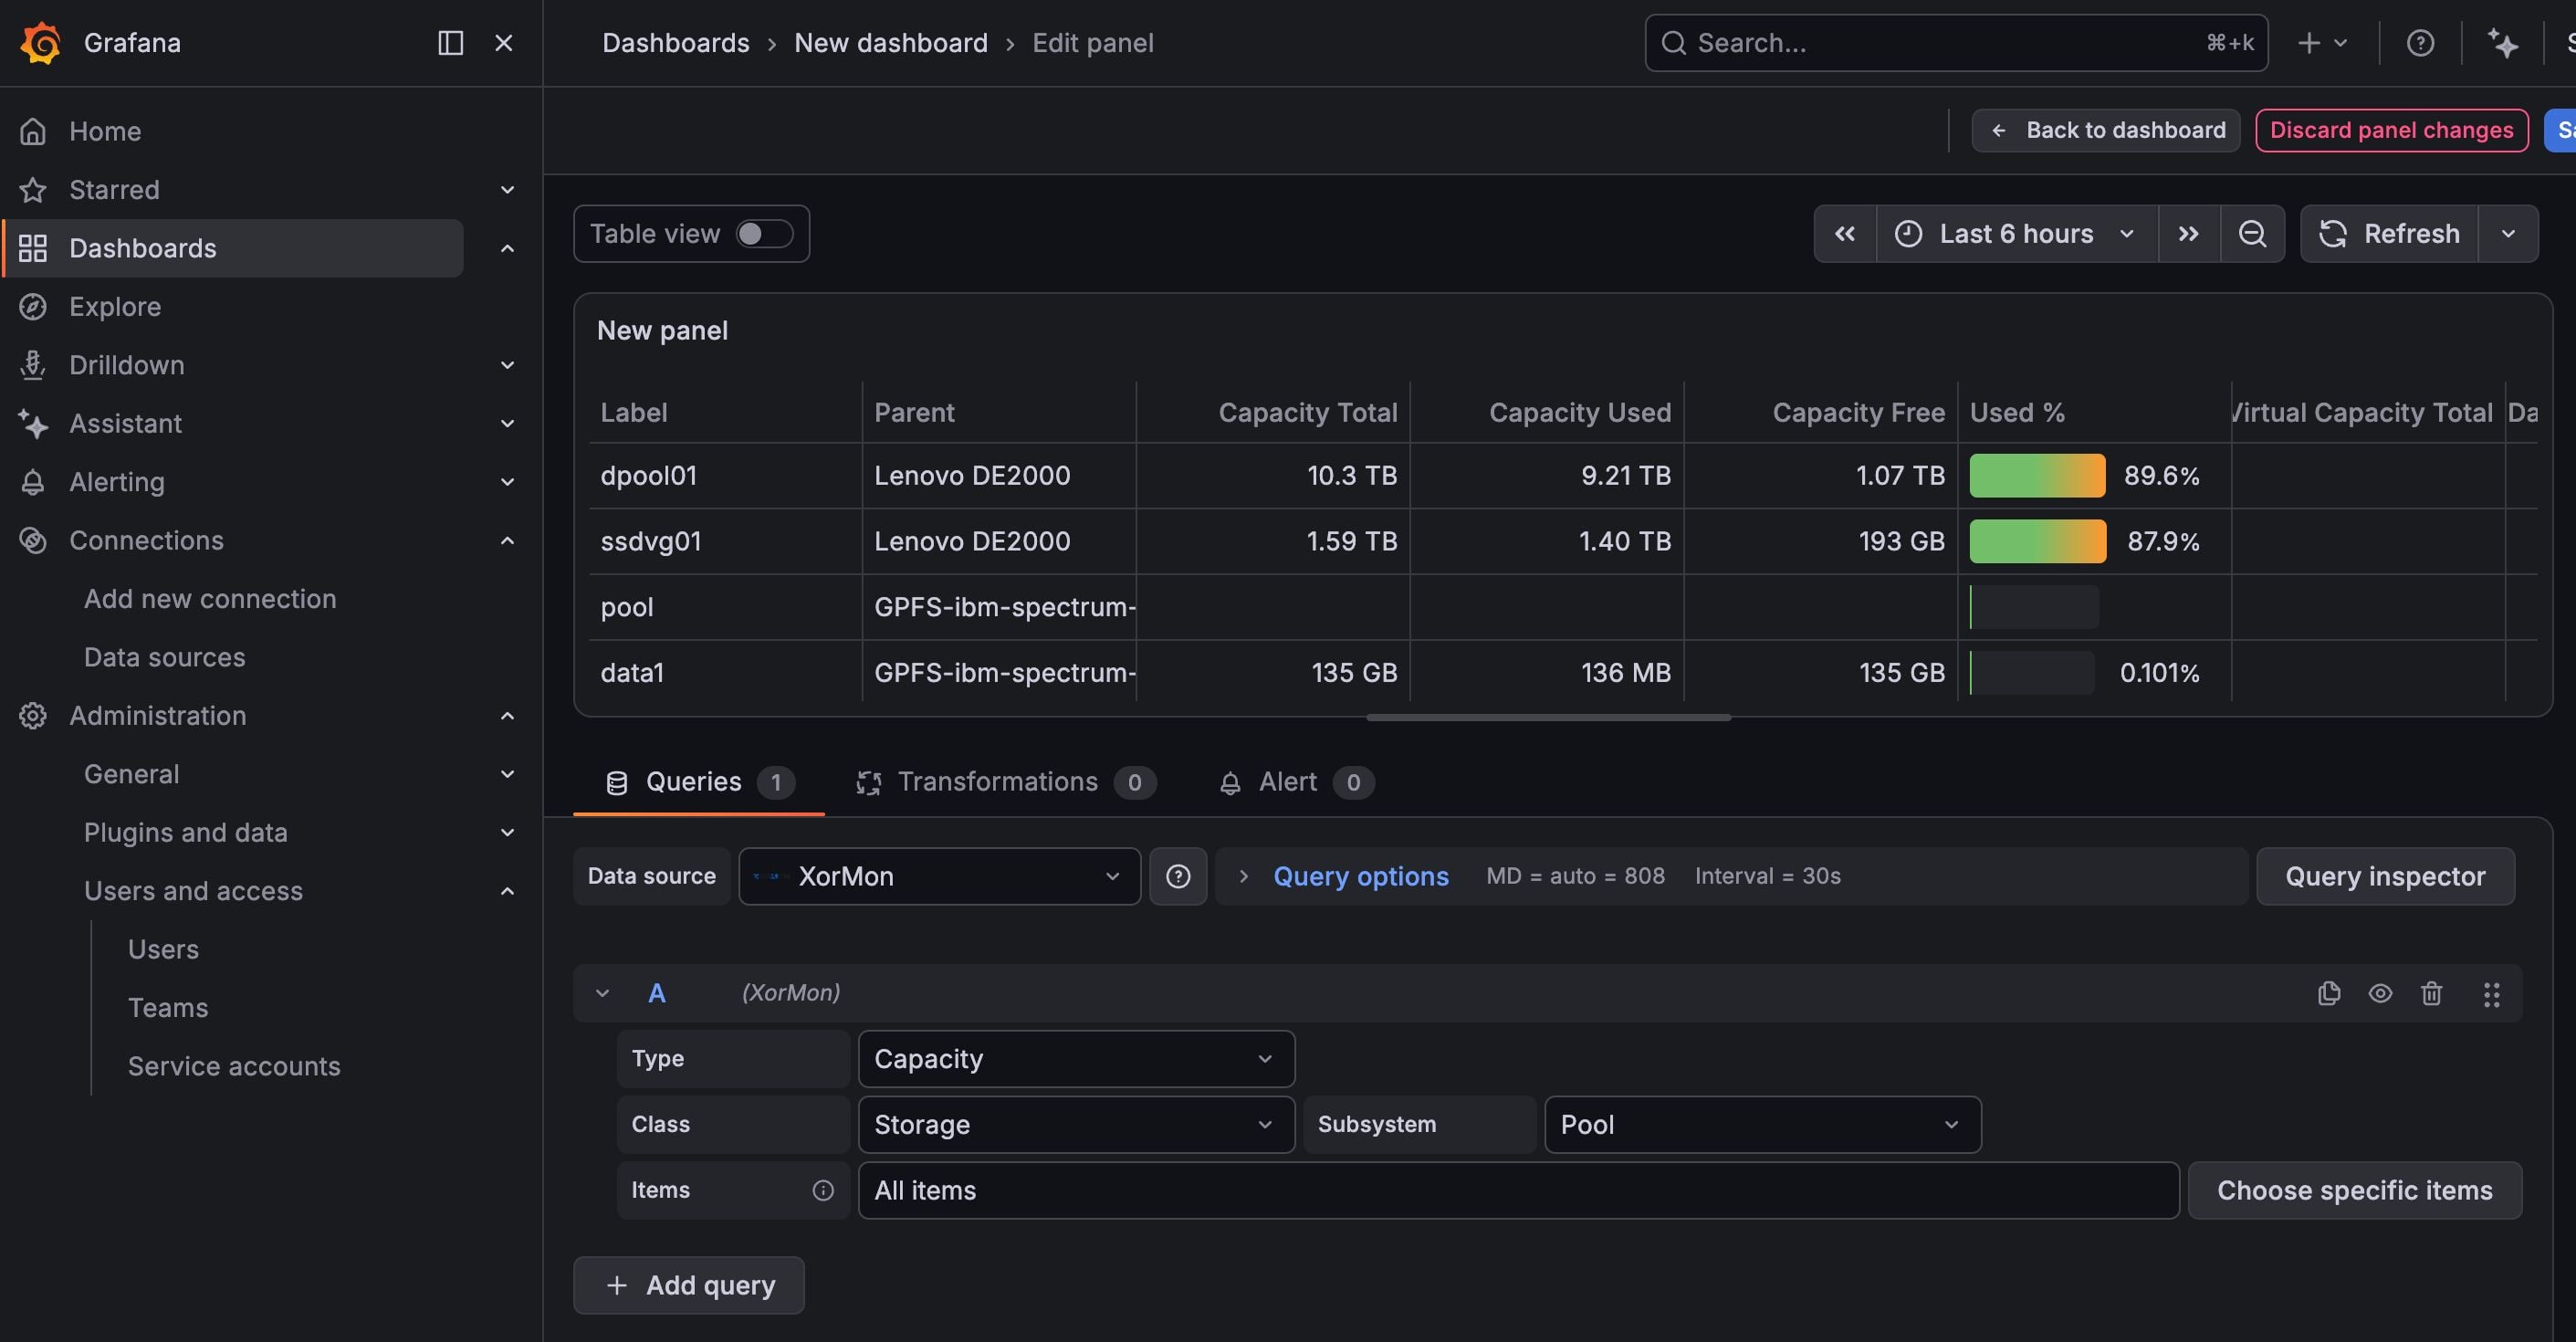
Table:
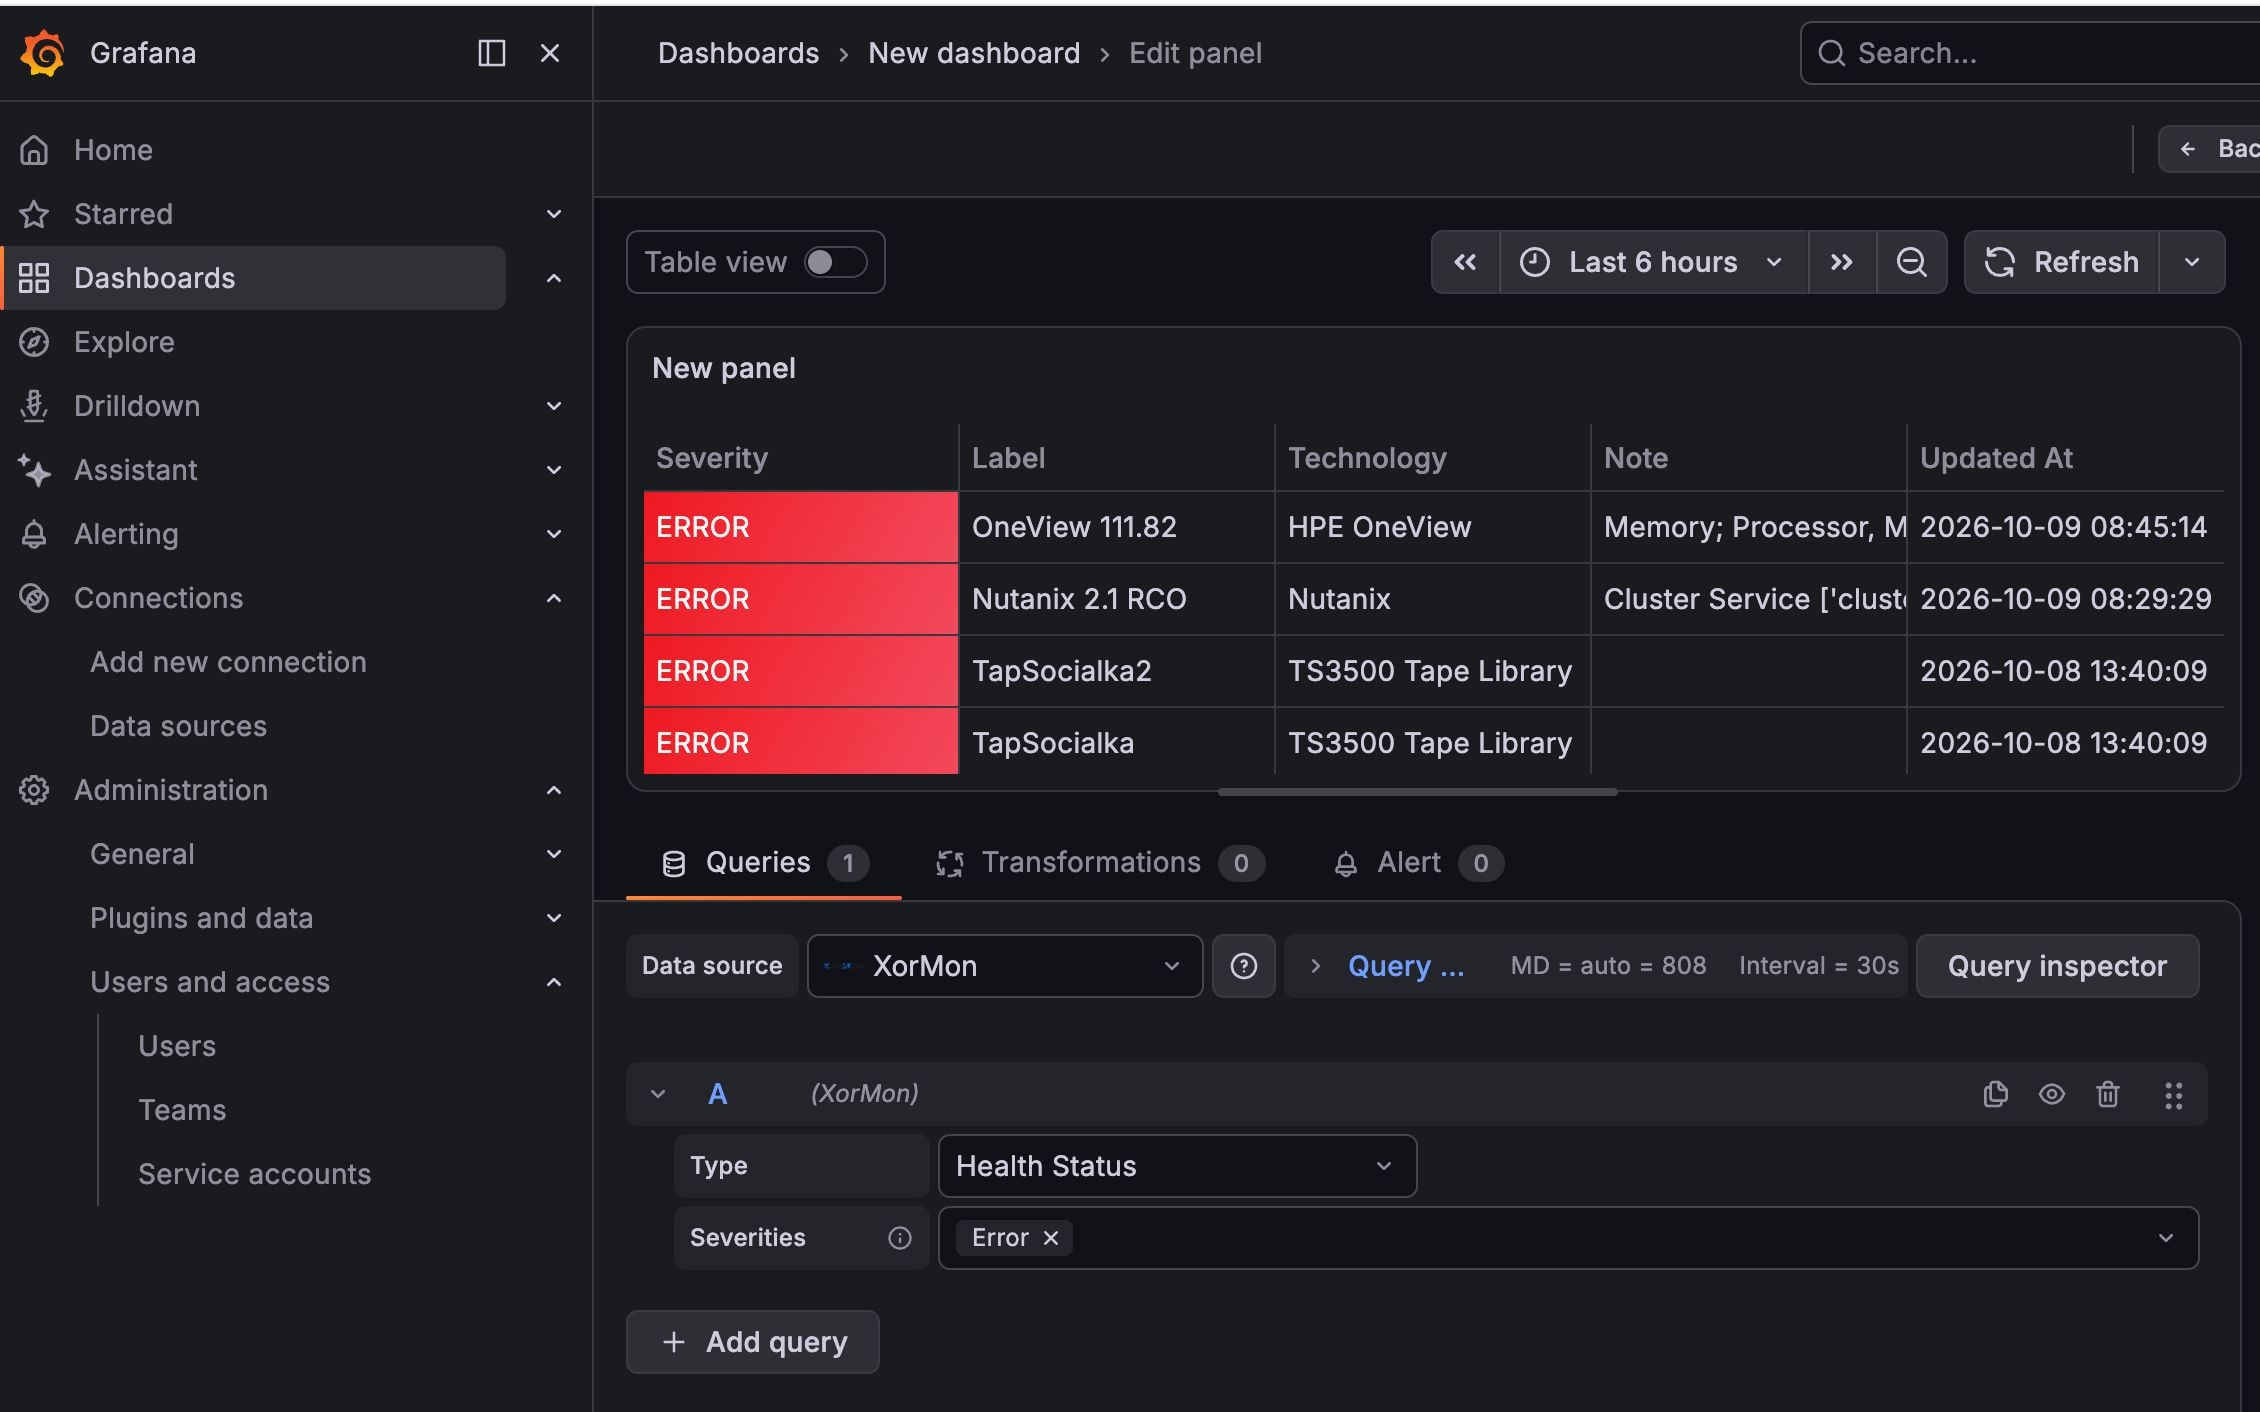
Health Status:
This will be release in XorMon v2.4.0
The XorMon plugin lets you query live metrics and health status directly from your XorMon server inside Grafana — no need to pre-import dashboards, the data updates the same way any other Grafana panel does.
Requirements
- Grafana 12.3.0 or newer.
- Network access from the machine running Grafana to your XorMon server (default port `8443`, HTTPS).
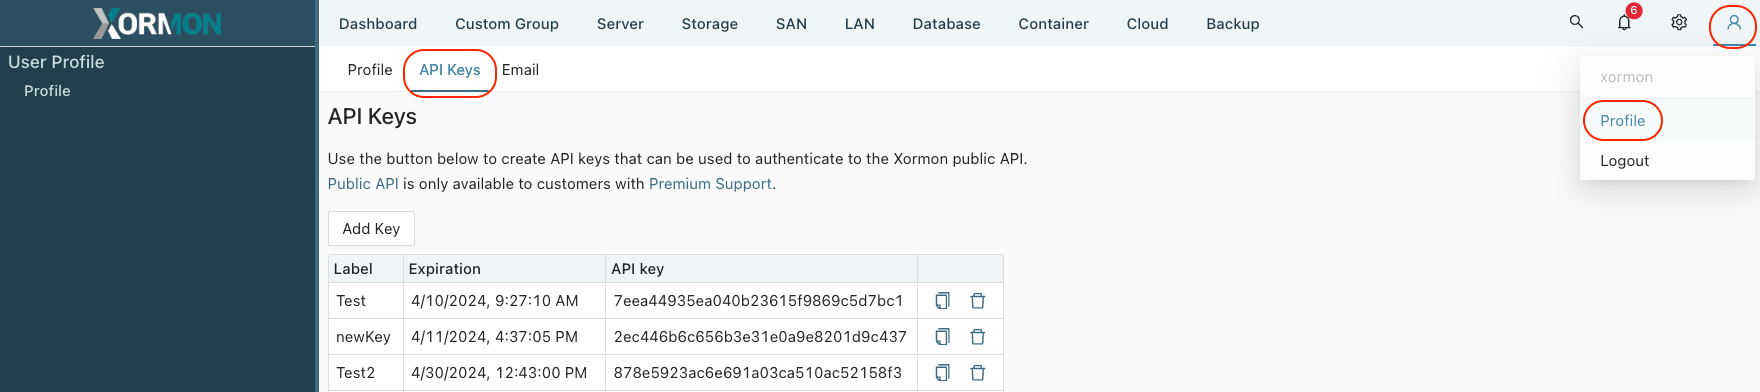
- A XorMon API key — generate one in the XorMon application under User ➡ Profile ➡ API Keys.
1. Download
Grab the latest release archive from
download page on the bottom (xorux-xormon-datasource-
.tar.gz)
2. Install the plugin
Extract the archive into Grafana's plugins directory. On a standard Linux install this is `/var/lib/grafana/plugins` (check the `plugins` path under `[paths]` in your `grafana.ini` if you're not sure):
tar -xzf xorux-xormon-datasource-.tar.gz -C /var/lib/grafana/plugins/
This creates a `xorux-xormon-datasource/` folder inside the plugins directory.
Running Grafana in Docker?
Extract the archive on the host first, then bind-mount the resulting folder into the container's plugins directory instead of copying it into the image.
The plugin isn't signed yet, so also set `GF_PLUGINS_ALLOW_LOADING_UNSIGNED_PLUGINS` (this replaces step 3 below — skip straight to step 4):
tar -xzf xorux-xormon-datasource-.tar.gz
docker run -d \
  -p 3000:3000 \
  -v "$(pwd)/xorux-xormon-datasource:/var/lib/grafana/plugins/xorux-xormon-datasource" \
  -e "GF_PLUGINS_ALLOW_LOADING_UNSIGNED_PLUGINS=xorux-xormon-datasource" \
  grafana/grafana
Or with Docker Compose:
services:
  grafana:
    image: grafana/grafana:latest
    ports:
      - "3000:3000"
    volumes:
      - ./xorux-xormon-datasource:/var/lib/grafana/plugins/xorux-xormon-datasource
    environment:
      GF_PLUGINS_ALLOW_LOADING_UNSIGNED_PLUGINS: xorux-xormon-datasource
docker compose up -d
If your XorMon server runs on the same machine as Docker, `localhost` inside the container refers to the container itself, not the host.
Use `host.docker.internal` as the Host field in step 5 instead, and (on Linux only) add `--add-host=host.docker.internal:host-gateway` to `docker run`, or `extra_hosts: ["host.docker.internal:host-gateway"]` under the `grafana` service in Compose.
3. Allow the plugin to load
This plugin isn't signed yet, so Grafana needs to be told to trust it explicitly. Add its ID to the unsigned-plugins allow list, either in `grafana.ini`:
[plugins]
allow_loading_unsigned_plugins = xorux-xormon-datasource
or via an environment variable:
GF_PLUGINS_ALLOW_LOADING_UNSIGNED_PLUGINS=xorux-xormon-datasource
(if you're running Grafana in Docker, you already set this above).
4. Restart Grafana
systemctl restart grafana-server
Running in Docker instead?
docker restart
# or, with Docker Compose:
docker compose restart grafana
5. Add the data source
In Grafana, go to Connections ➡ Data sources ➡ Add data source and search for XorMon.
Fill in:
| Field | Description |
|---|
| Protocol | `http` or `https`, matching your XorMon server |
| Host | Hostname or IP of your XorMon server |
| Port | Usually `8443` |
| Skip TLS verify | Enable this if your XorMon server uses the default self-signed certificate |
| API Key | The key you generated in Settings ➡ API keys |
Click Save & test — it should confirm a successful connection.
6. Build your first panel
Open Explore (or add a panel to a dashboard) and pick the XorMon data source.
The query editor starts with a Type selector:
- Timeseries:pick Class ➡ HW Type ➡ Subsystem (for the Storage, SAN and LAN classes, HW Type is skipped — the subsystem list already spans every hardware type), then the Items to graph (or click Select all to always include every matching item, resolved fresh each time the query runs) and the Metrics to plot.
When exactly one item is selected, you can assign a fixed color per metric; with several items, Grafana's own color palette takes over.
Optionally enable Filter by parents to pick items indirectly through their parent devices.
- Health Status: shows a color-coded table of device health (OK / Warning / Error / Unknown / Test), with an optional filter by severity.
- Capacity: a color-coded table of capacity figures (Total / Used / Free, Used %, and reduction/dedupe ratios where available) for Storage Device, Pool or Volume items.
Troubleshooting
- "Missing API key" / "Bad or expired API key": the key may have expired or been revoked; generate a new one in XorMon under Settings ➡ API keys.
- Class / HW Type / Item dropdowns stay empty: check that the Grafana server (not your browser) can reach the XorMon host and port you configured; test connectivity from the Grafana host itself, e.g.
`curl -k -H "apiKey: " https://:/api/public/v1/architecture/classes`.
- TLS / certificate errors: enable Skip TLS verify in the data source settings if your XorMon server uses its default self-signed certificate, or install a CA-signed certificate on the XorMon server.
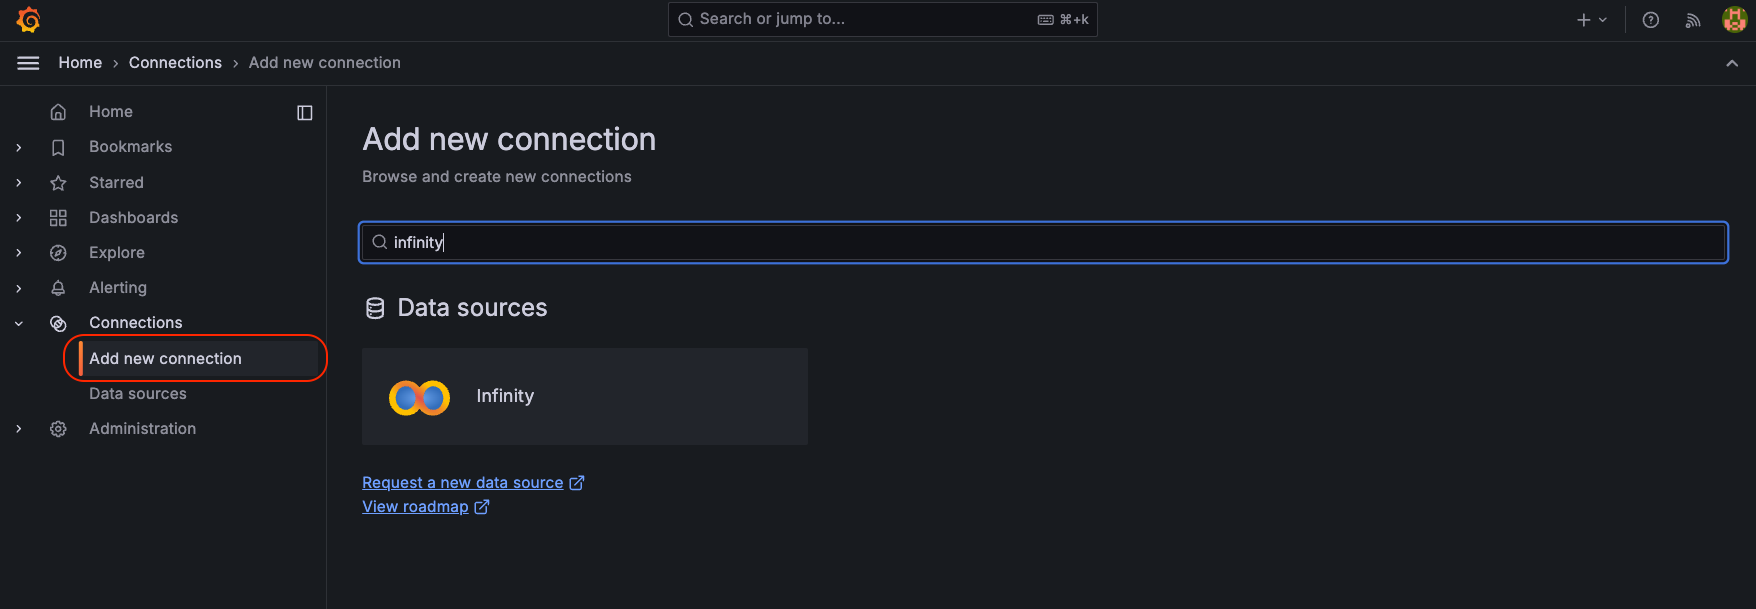
Connections -> Add new connection
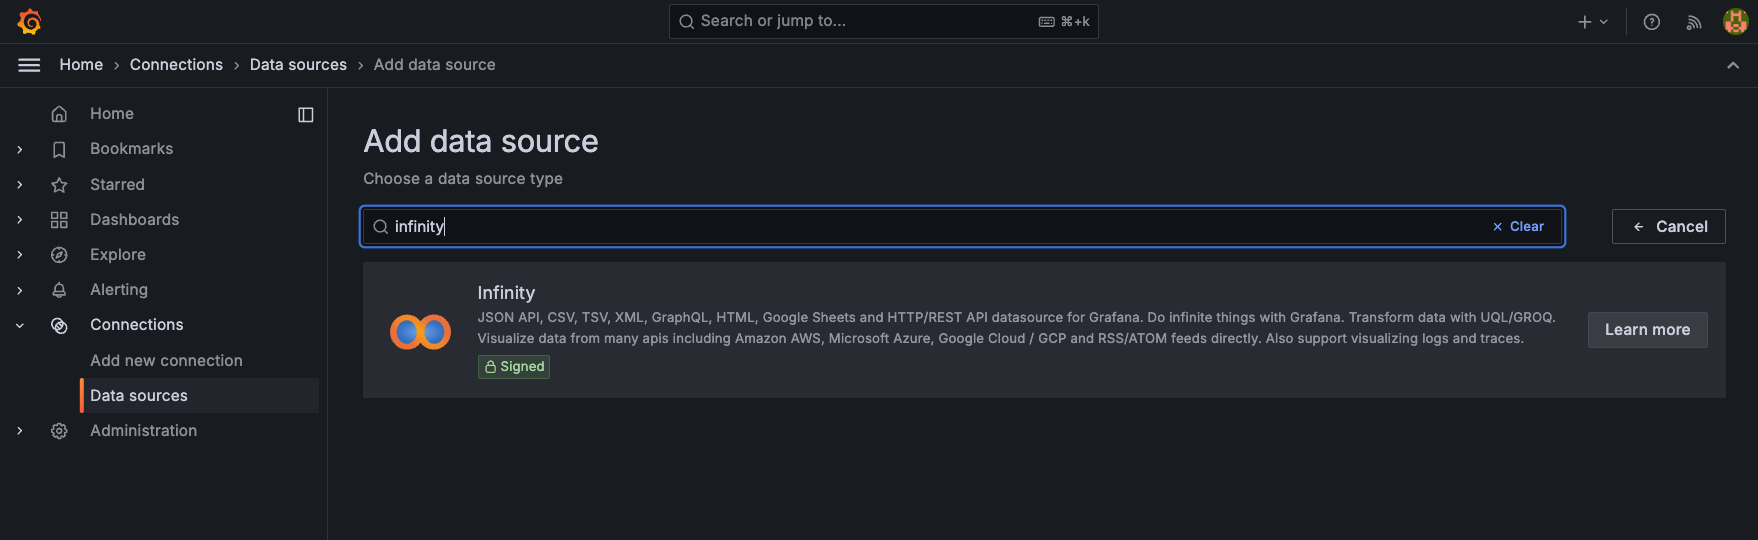
Search for Infinity
Click on Infinity and install it
Connections -> Data sources -> Add data source
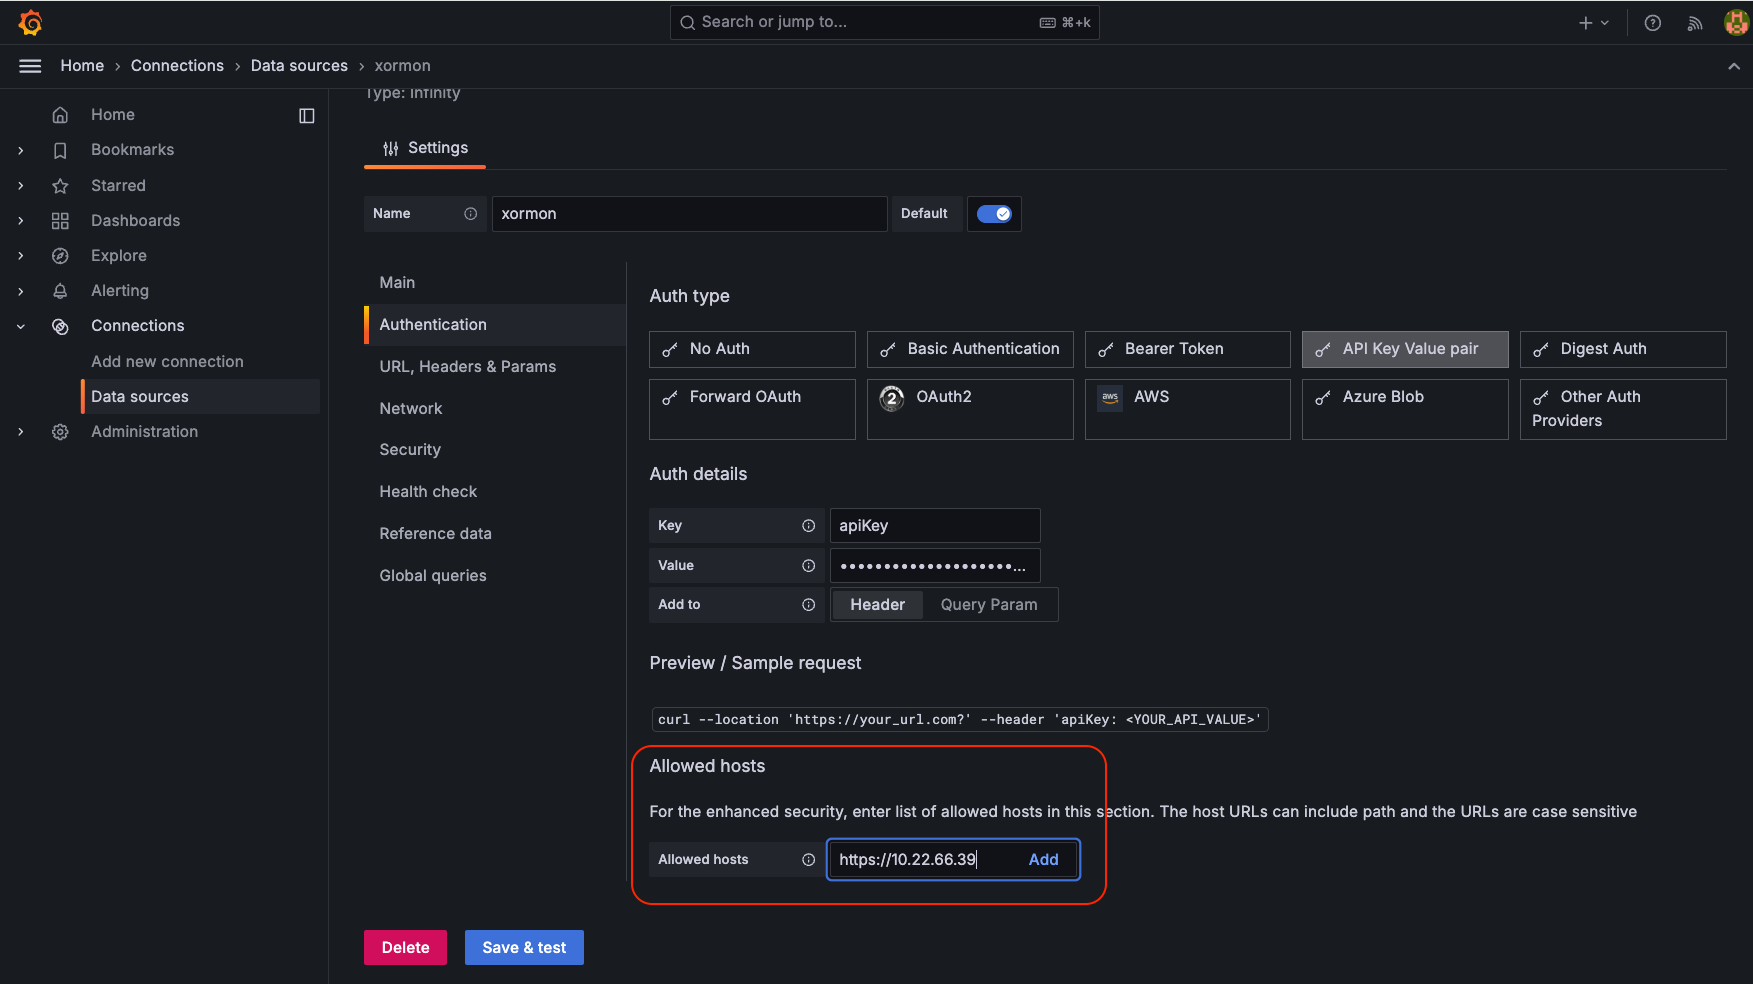
Find Infinity source type
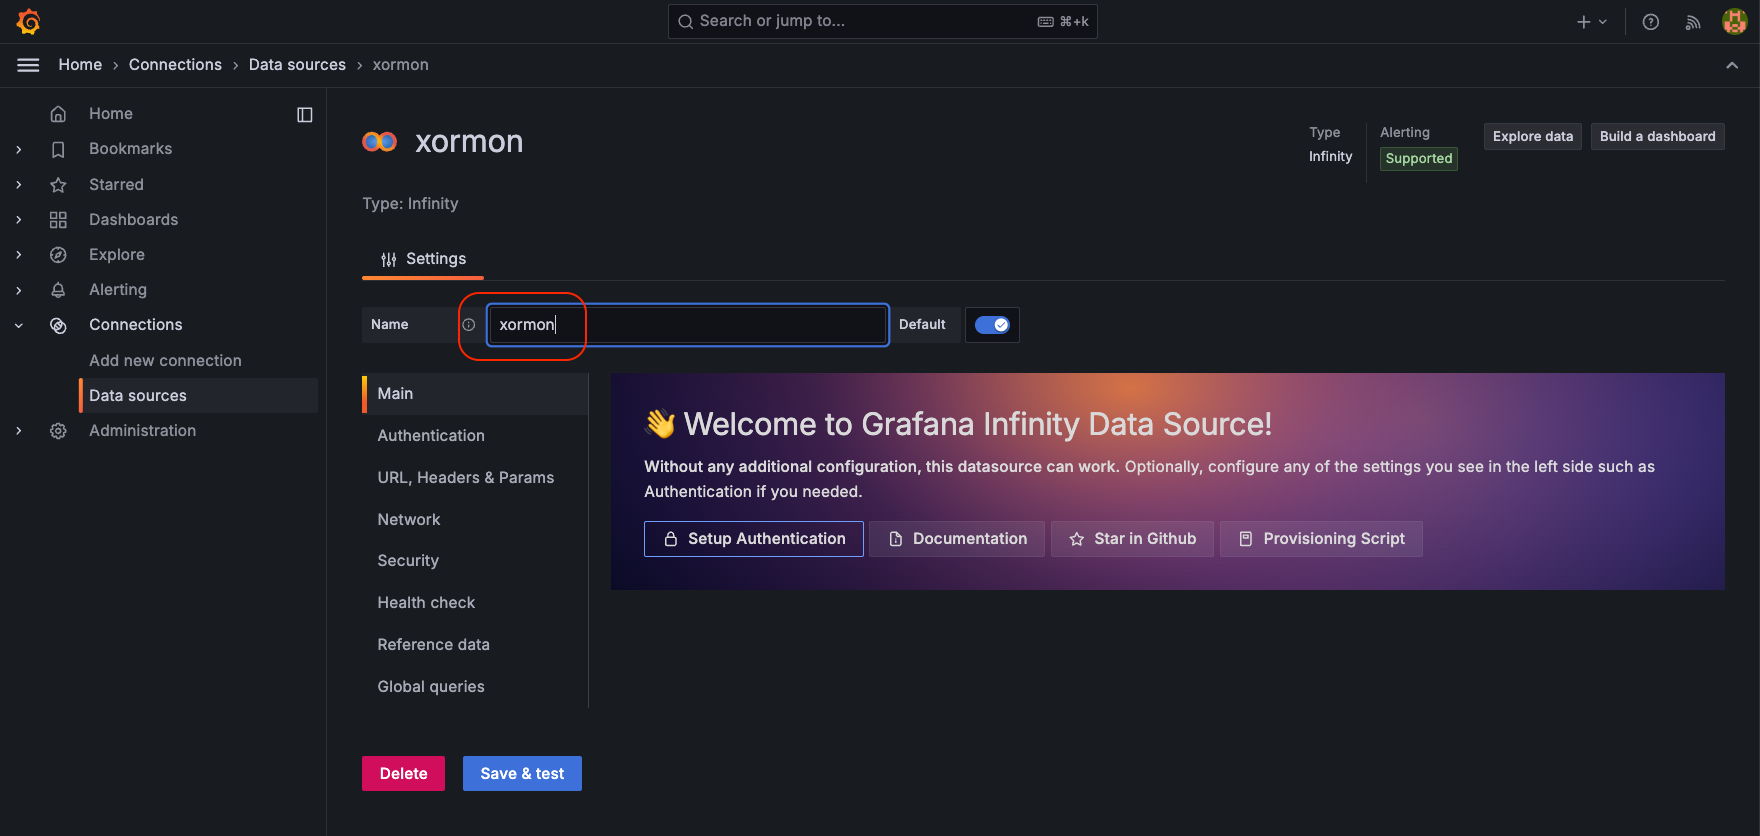
Set label as „xormon“ ( For functionality it is important that the datasource is named „xormon“ )
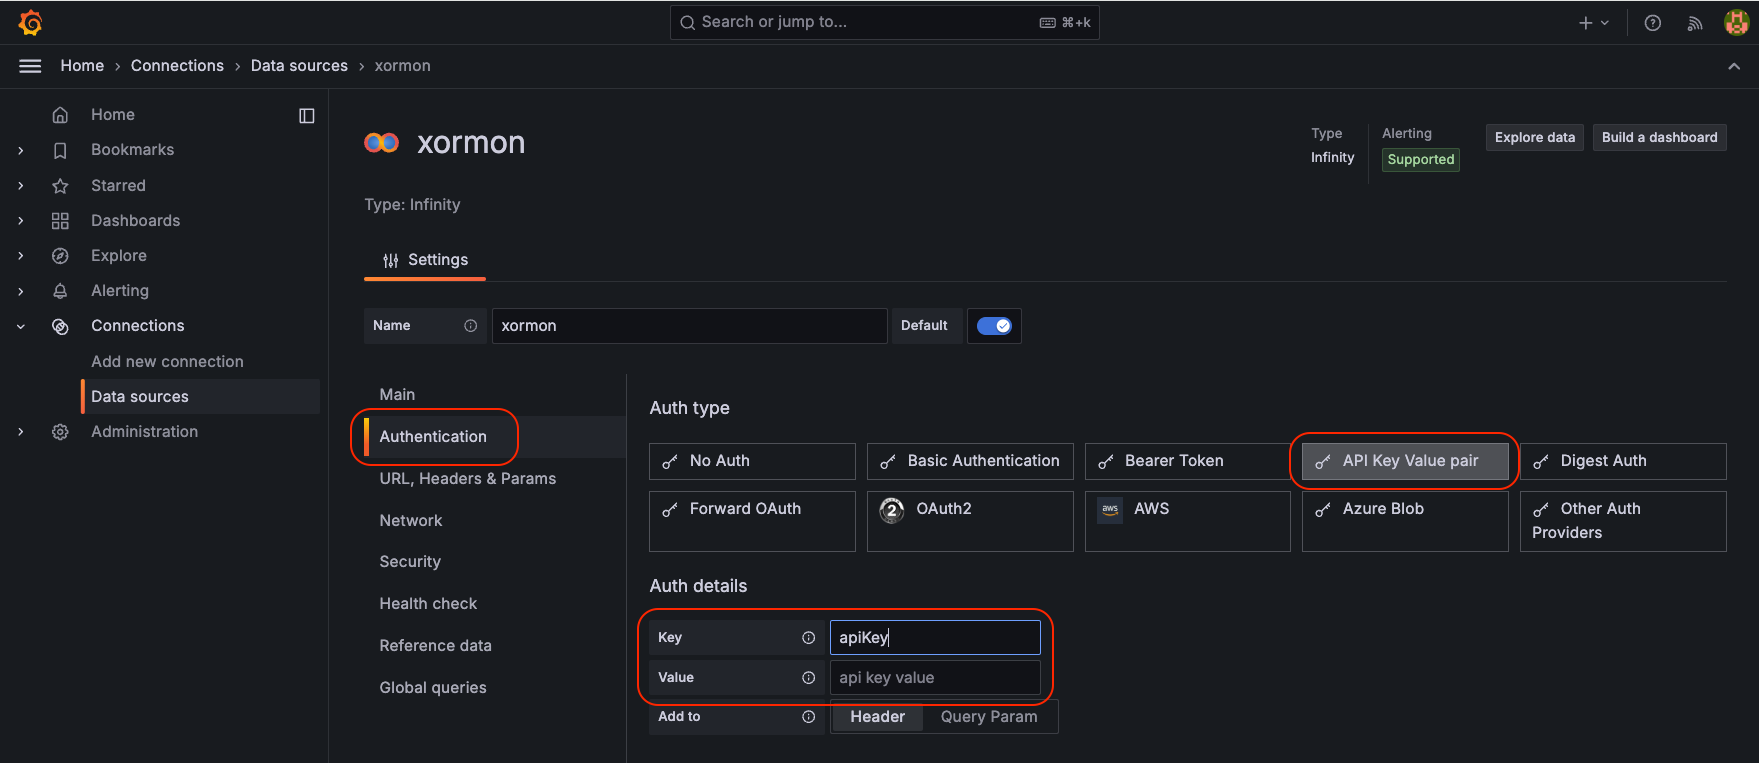
Set authentication as an API key, which is generated in XorMon under User -> Profile -> API Keys
Add XorMon url to allowed hosts
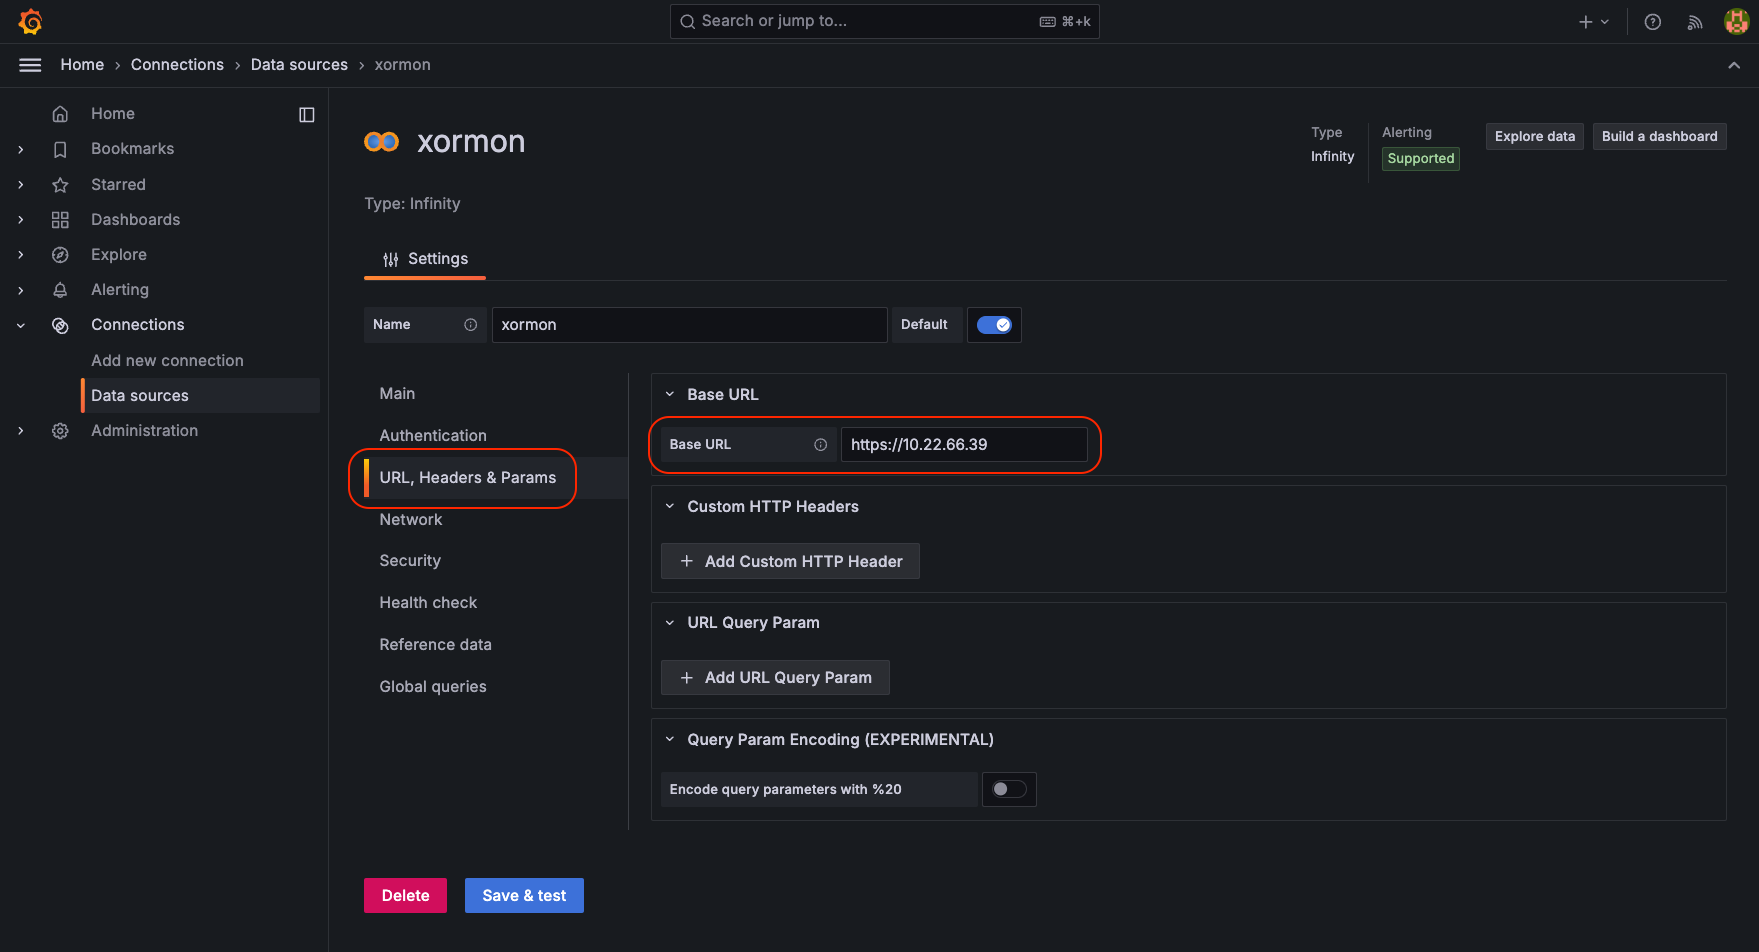
Set XorMon URL as base URL
If XorMon UI is running on different port than 443 (like 8433), use it in URL like https://10.22.66.38:8443
Note XorMon REST API running on the same port as XorMon UI
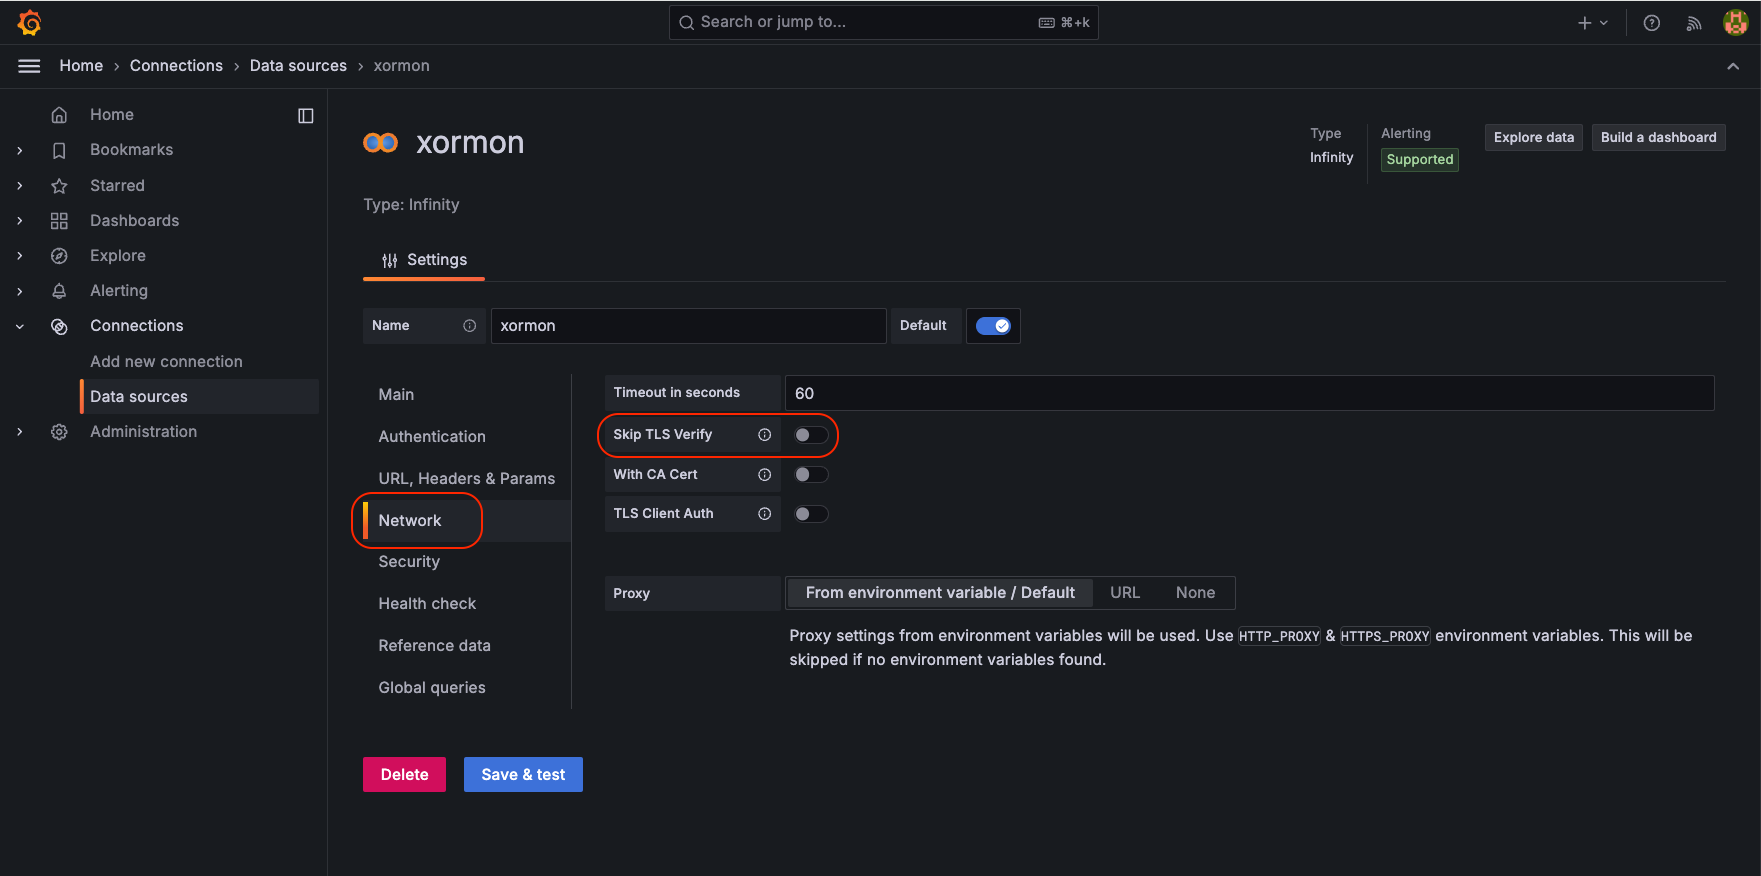
Optional - if you do not have a valid certificate on the XorMon instance, enable skip tls verify
And save.
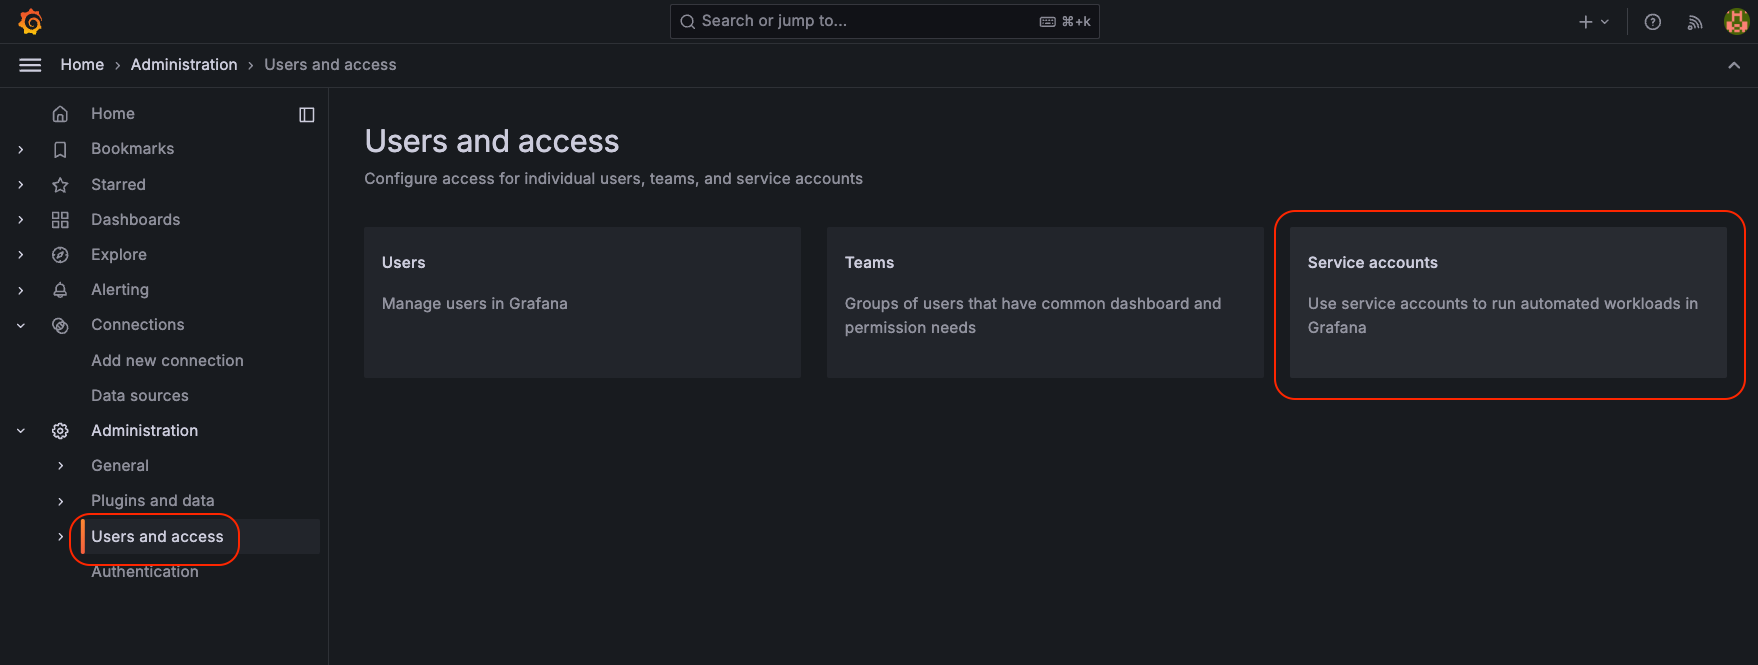
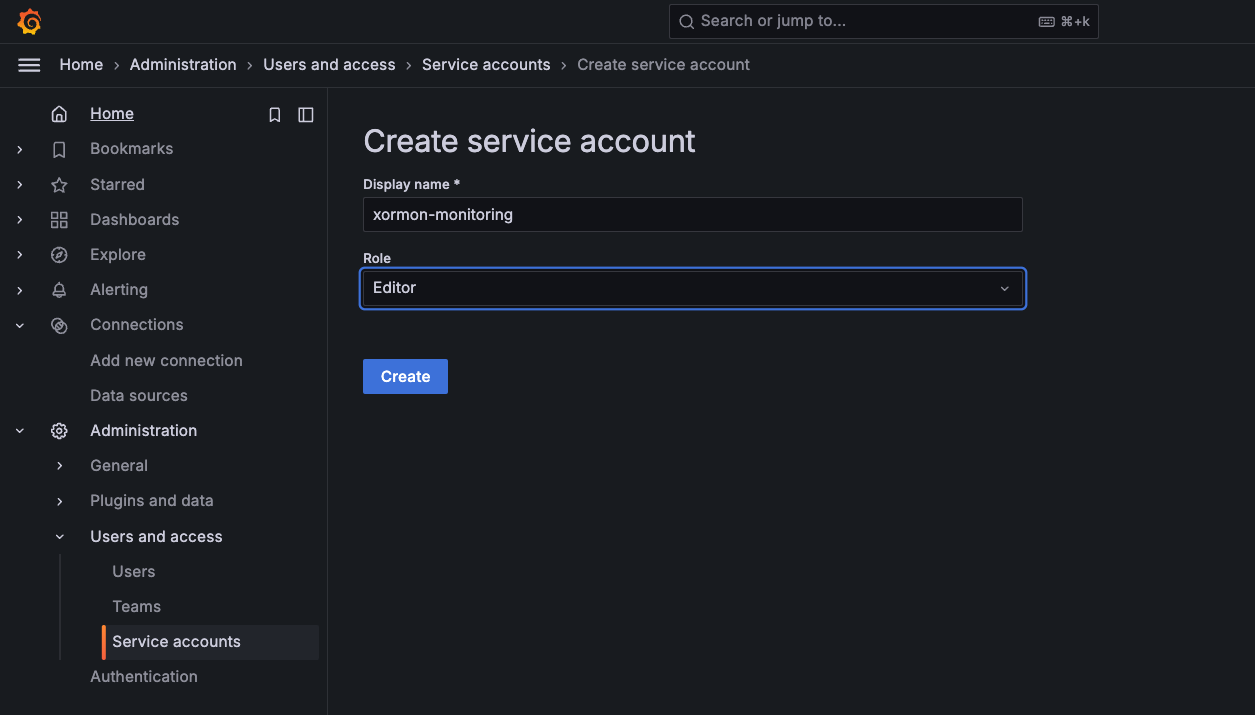
Now you need to generate a token. Administration -> Users and access -> Service accounts -> Add service account
Set editor role
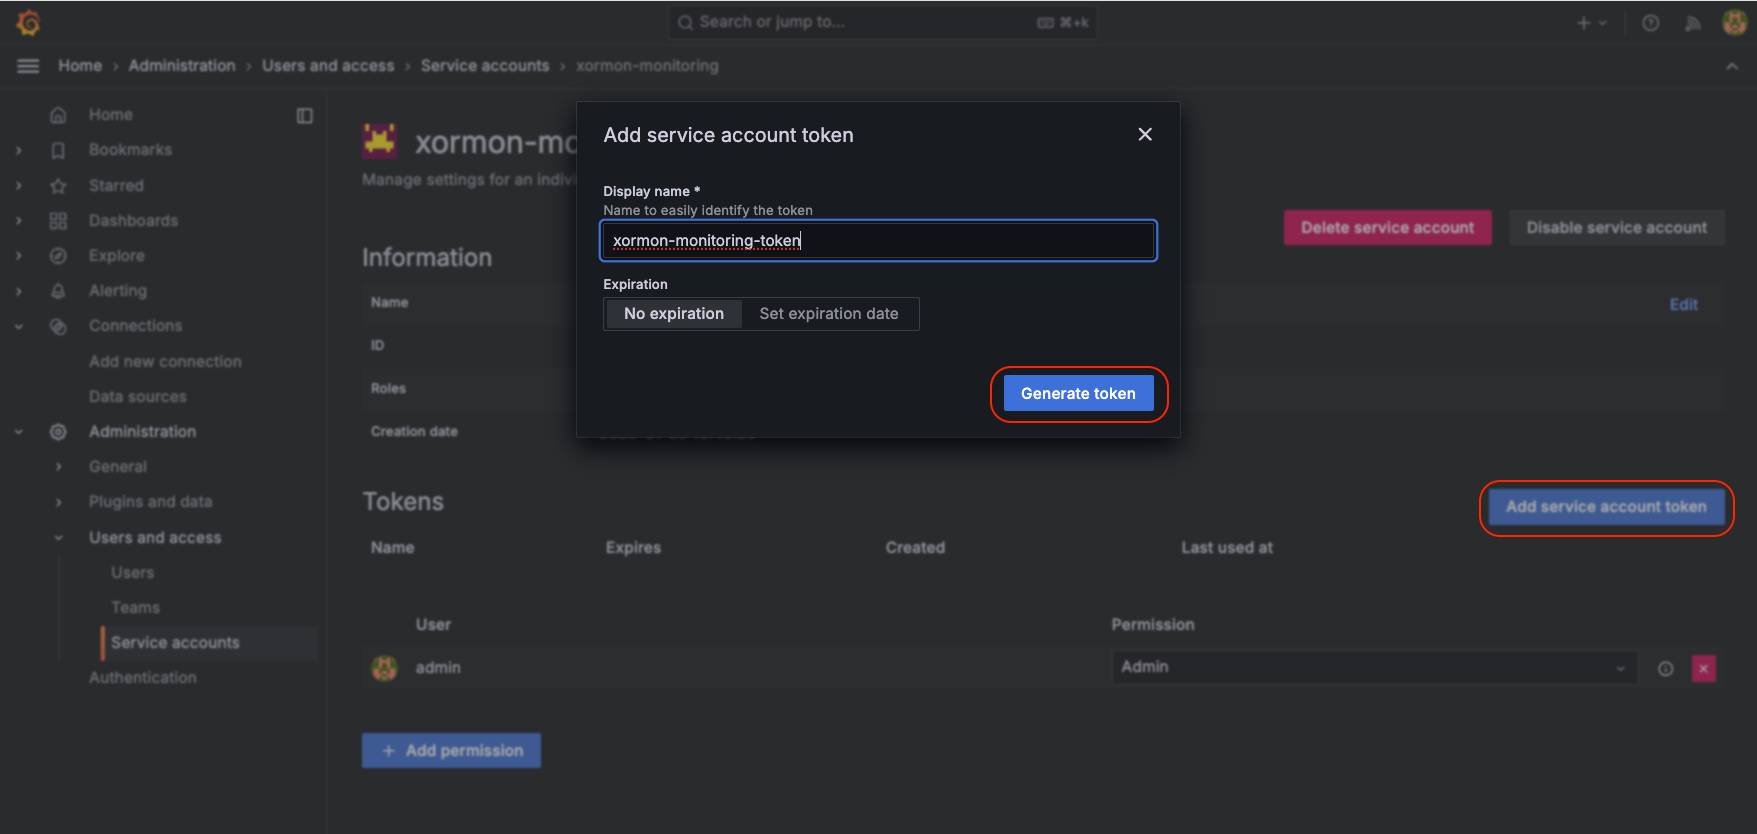
Generate a new service account token
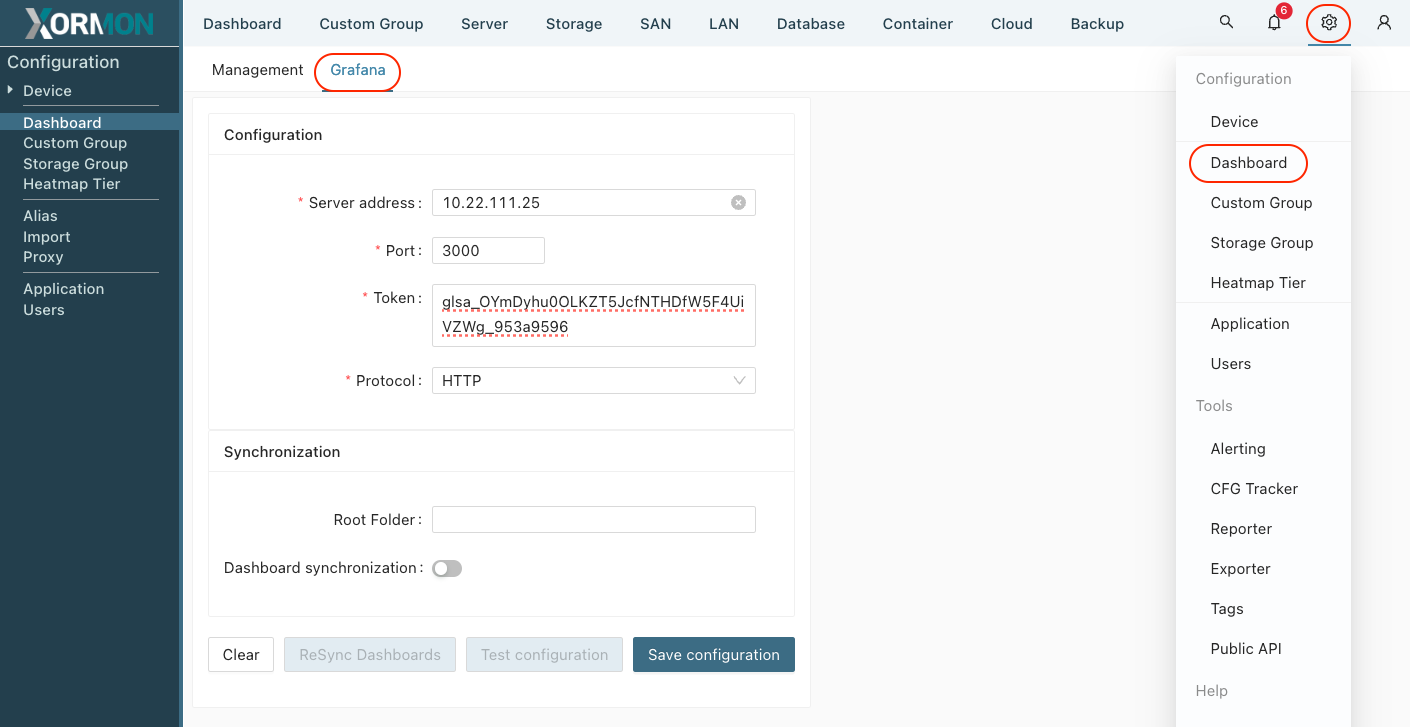
Enter this token into the Grafana configuration in XorMon. Go to Settings -> Dashboard -> Grafana and fill out the form
If you want to have your XorMon dashboard synchronized to Grafana, turn on Dashboard synchronization. You can also specify the folder to which the dashboard will be synchronized.
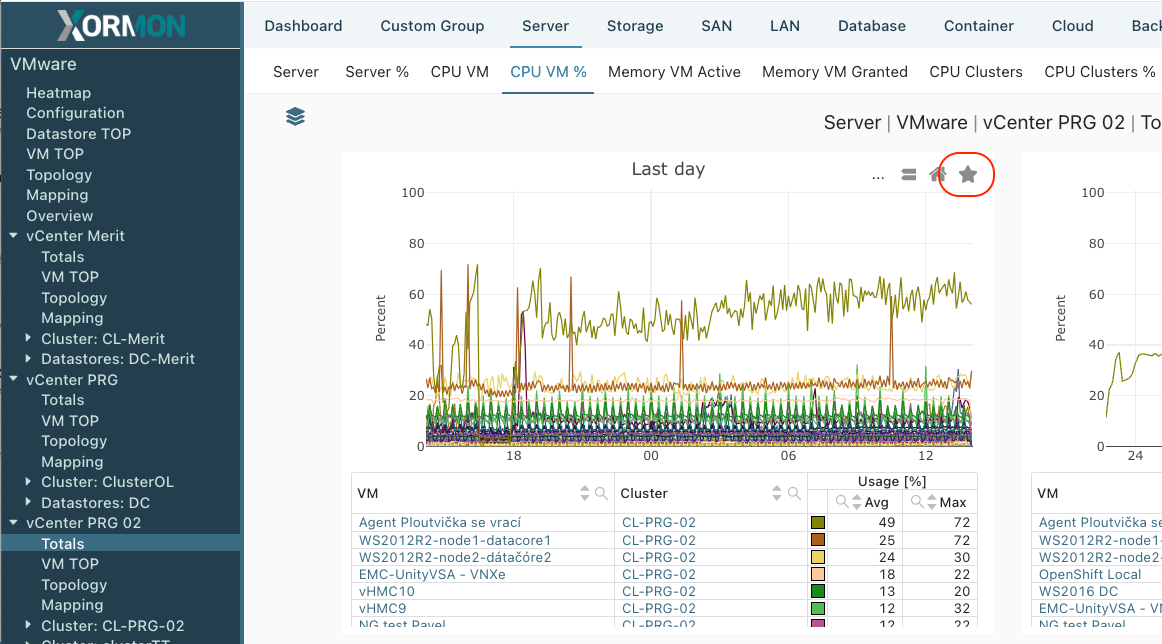
If you want to import a chart into Grafana Dashboard, click on the star (as if you were adding a chart normally to a dashboard)
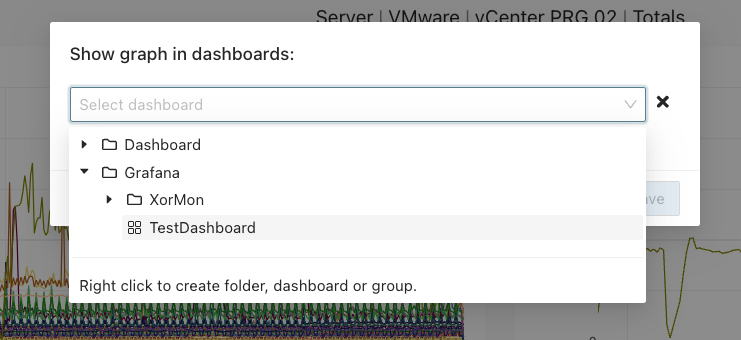
And select the dashboard in Grafana where you want to import the chart
And select the dashboard in Grafana where you want to import the chart