SAN monitoring
Monitored devices
- Broadcom (Brocade) and all its re-brands
- Broadcom (Brocade) SANnav v2
- Cisco MDS
- Cisco Nexus
- QLogic
Used data sources (APIs)
- Broadcom (Brocade): REST API
- Broadcom (Brocade), Cisco: SNMP
- Broadcom (Brocade) SANnav v2
Monitored metrics
- Data throughput [MB/sec, Mbit/sec]
- Frame throughput [frames/sec]
- Errors: CRC, encoding, enc out, disc c3 frames, link fail, loss sync, PCS [frames/sec]
- CPU, Memory usage
- Buffer credits usage
- SFP Power
Aggregated graphs per
- Port
- Switch
- Fabric
- All switches total
- ISL (Inter Switch Link)
Additional features
- Brocade vFabric support
- Cisco VSAN support
- Graphical healthcheck (HW or logical issues on ports or switches)
- Historical reporting
- Alerting: performance metrics
- Alerting: HW issues
- Topology
- CPU and memory
- Zone configuration (only via SANnav, Brocade REST API)
Example
Switch summary |
Total
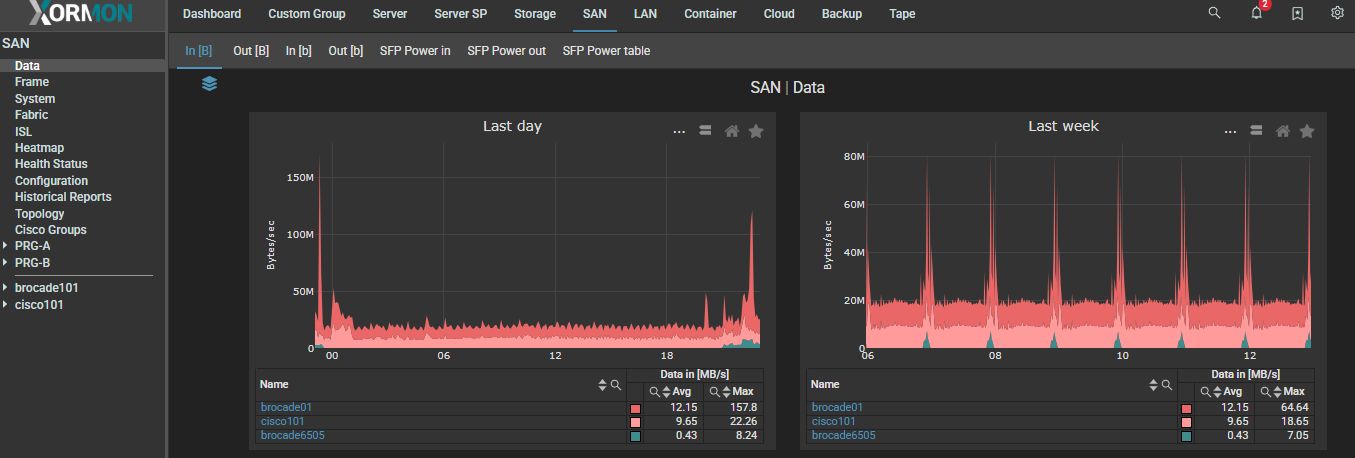 |
Topology
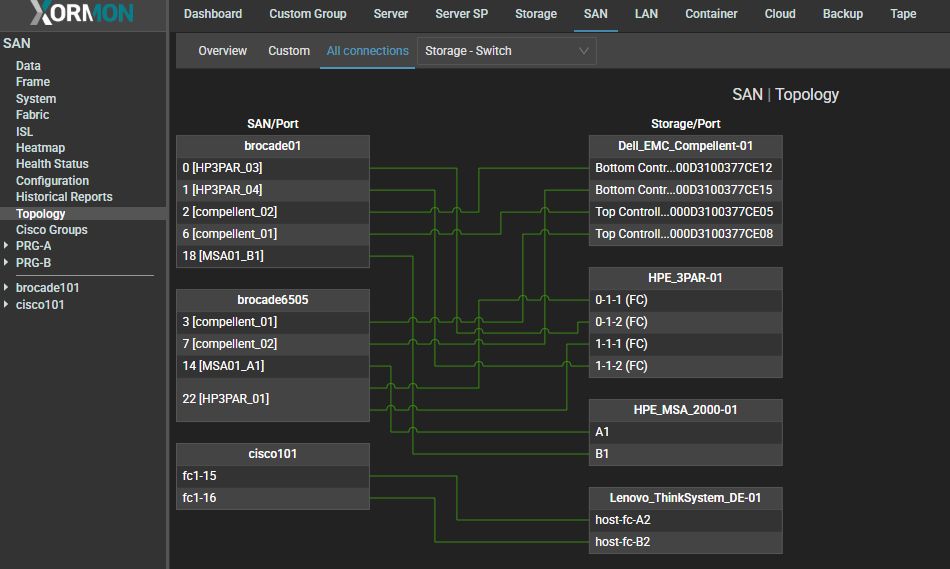 |