Topology
It allows the user to visualize the logical or physical connection of individual components.
Such visualization can be very useful in finding dependencies in large and complex environments.
Topology is currently supported by the following systems in XorMon:
Topology provides different types of views:
- Overview: device level view
- All connections: detailed view of all links
- Custom: limited veiw for selected devices
- Drag to move the topology map
- Scroll to zoom in/out
- Click on a parent component to highlight all connections originating from that component
- Click on a specific port to highlight the path to the destination port
- Hover over a connection to view utilization and WWN information
- The color of individual connections indicate utilization
Video
Examples
Overview: AIX: from FS to disk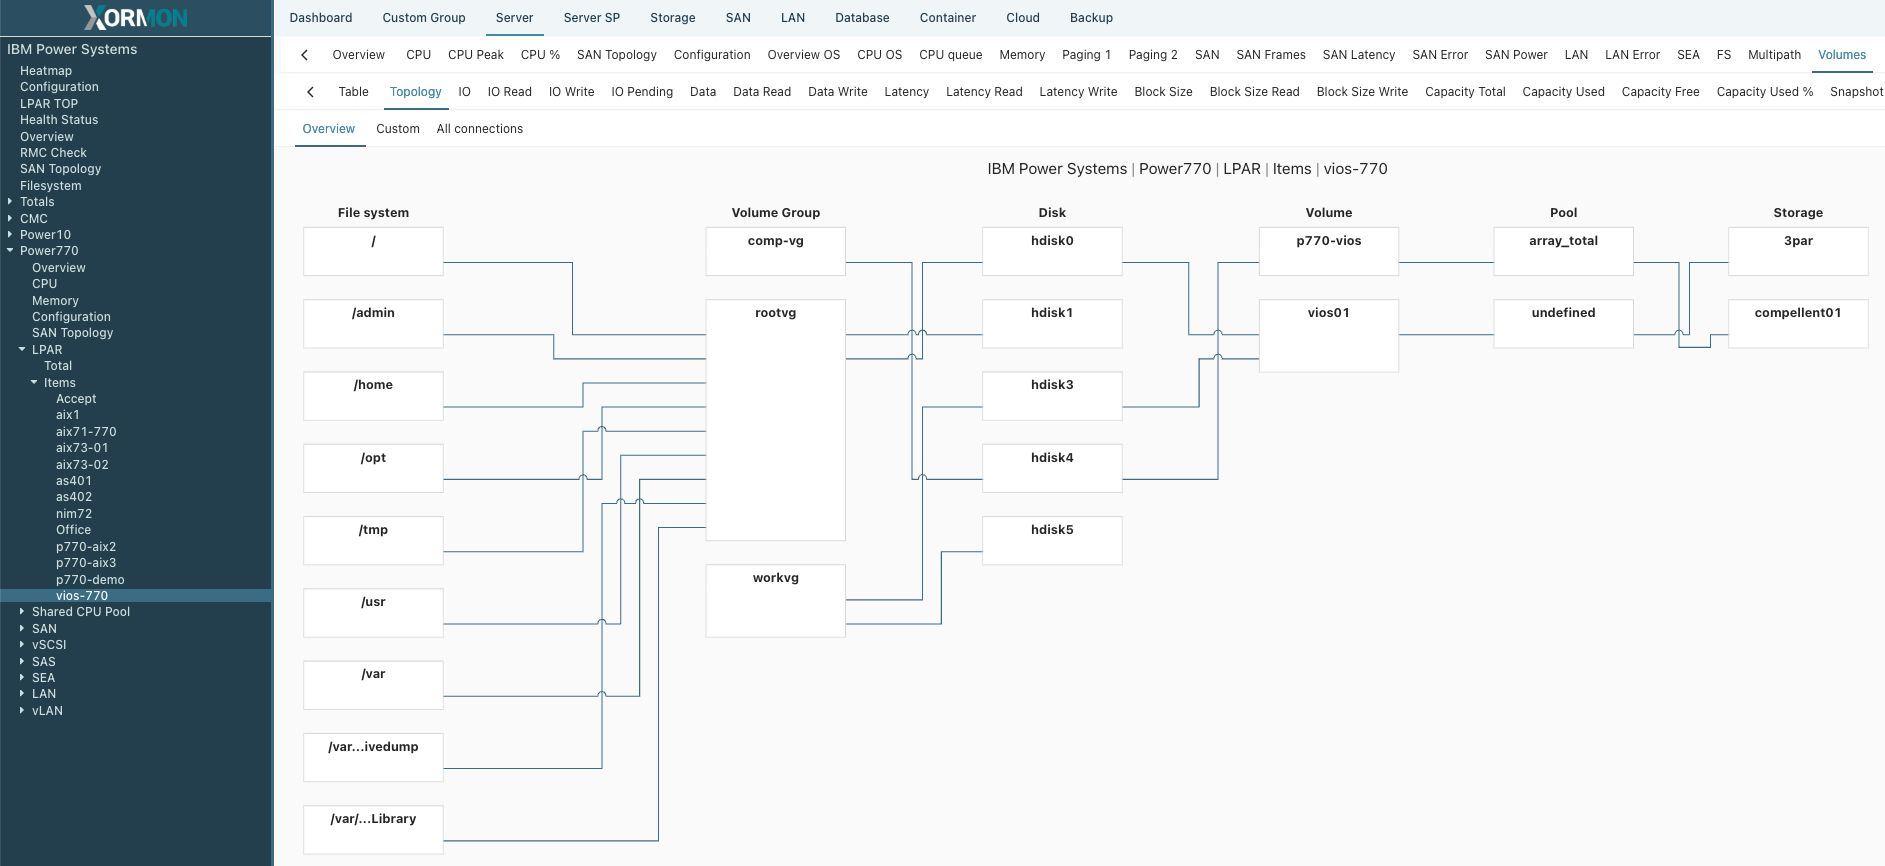 |
Overview: SAN / Storage 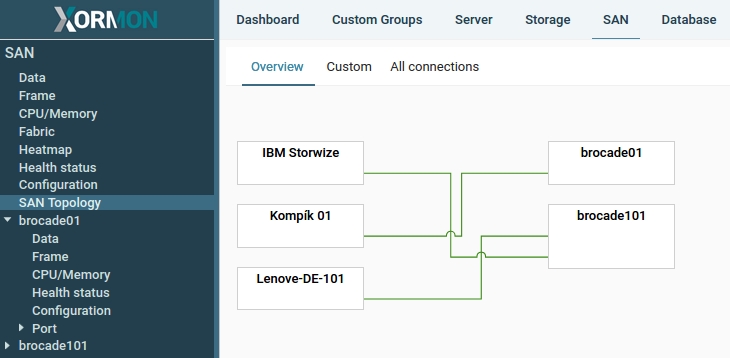 |
All connections: SAN / Storage 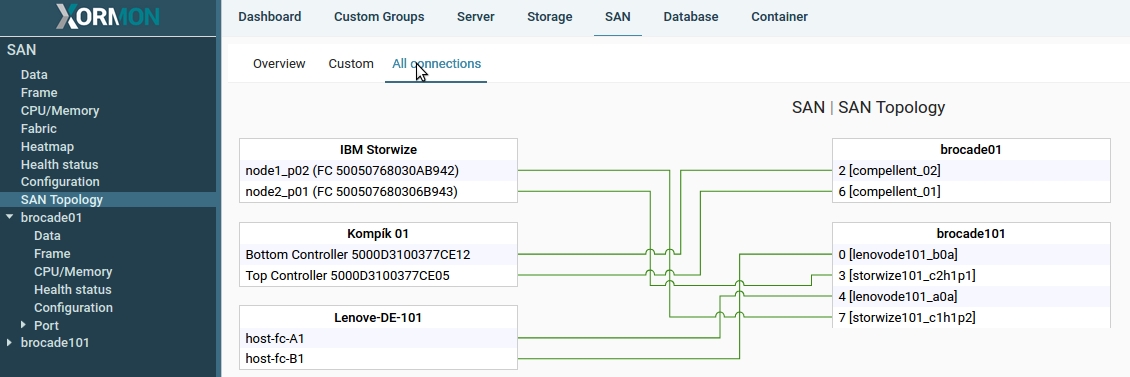 |
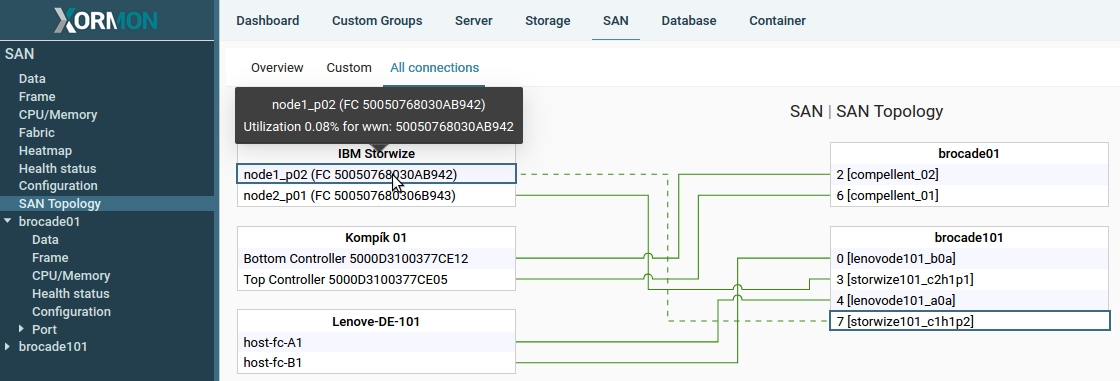 |
Selected Storage 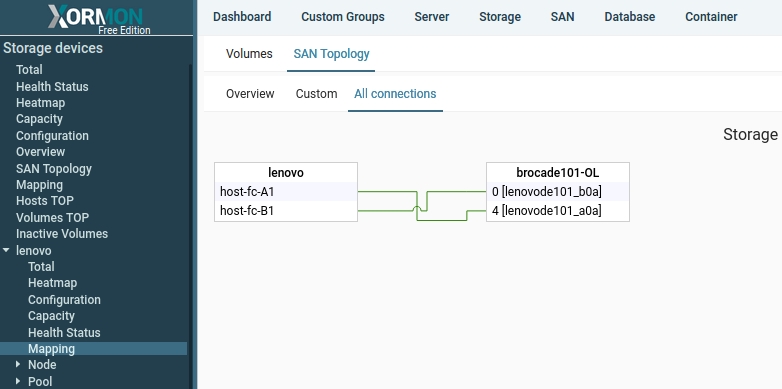 |
IBM Power Systems 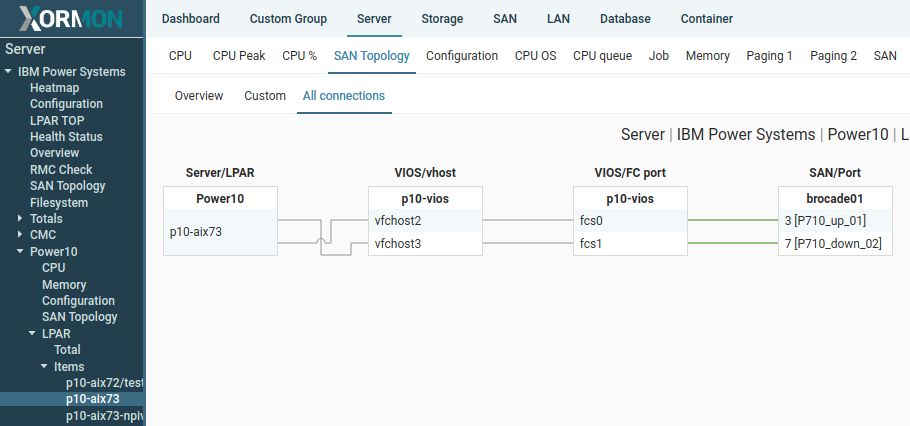 |
 |
VMware 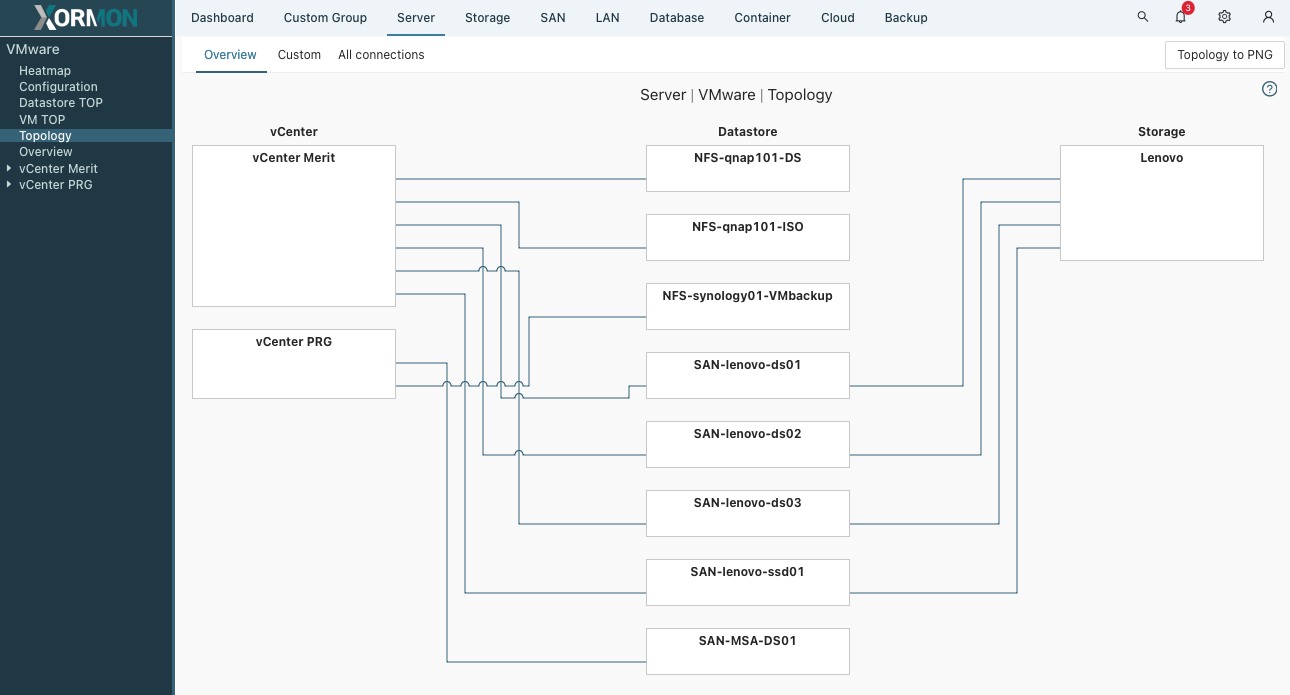 |
 |
Nutanix  |
Proxmox 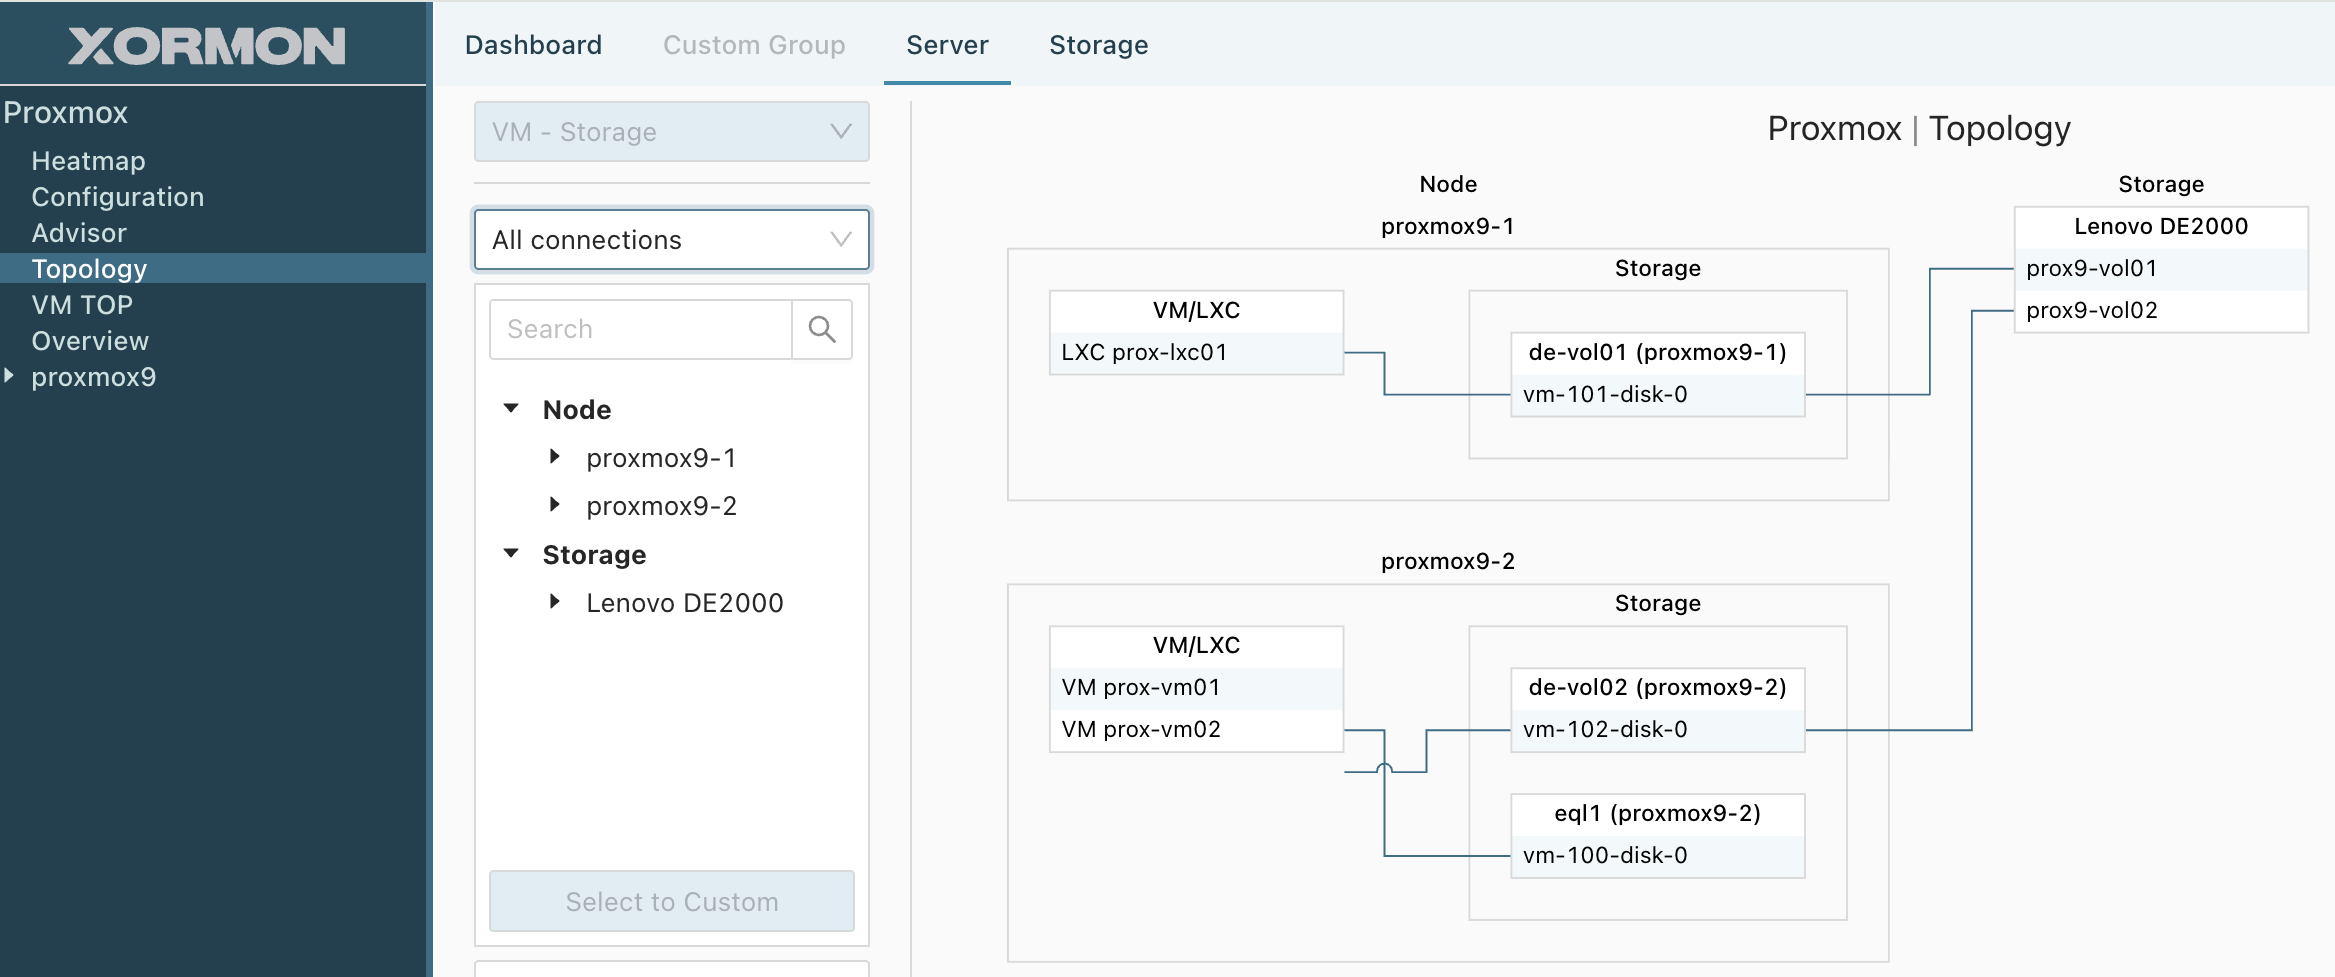 |