NFS monitoring
NFS monitoring tracks the performance of network file system mounts, such as throughput, IOPS, latency and errors. XorMon, open source under GPL v3, monitors NFS client performance of all mounted NFS filesystems on Linux through its OS agent, based on the nfsiostat command, and collects data, IOPS, retransmissions, latency, queue wait and errors.
What is NFS monitoring?
NFS monitoring is the continuous tracking of the performance of NFS (Network File System) mounts, so that slow or failing file access is found before applications are affected.
In XorMon, NFS monitoring on the client side is part of the Linux OS agent: NFS performance is listed among its metrics and features, next to filesystem usage, LVM, multipath and ZFS. The agent runs on Linux on Power, Linux x86 and Linux ARM. When Linux is monitored under a virtualisation technology such as VMware, Proxmox, IBM Power Systems, RHV, oVirt, OLVM or Nutanix, its OS agent data is mapped to the virtual machine. On the storage side, the feature matrix lists NFS IO and data for Everpure (Pure Storage) FlashBlade, and XorMon 2.4.0 added NFS export policy and NFS session tabs for NetApp and NFS protocol latency per storage processor for Dell EMC Unity.
Sources: Linux monitoring, updated 2026-10-21, Feature matrix, and Release notes 2.4.0.
Which NFS performance metrics does XorMon collect?
XorMon collects six NFS client metrics for all mounted NFS filesystems: data in bytes per second, IOPS, retransmissions, latency and queue wait in milliseconds, and errors.
The feature matrix lists the same set for the Linux OS agent as data, IOPS, retrans, latency, error and queue, and the examples below show graphs for data, IOPS, latency and queue. On the same host, the OS agent also collects CPU usage, CPU queue, memory usage, paging, LAN and SAN adapter throughput, total IO throughput and filesystem capacity usage.
Sources: Feature matrix, Linux tab, and Linux monitoring, updated 2026-10-21.
How does XorMon collect NFS statistics on Linux?
The XorMon OS agent reads NFS client statistics with the nfsiostat command on each Linux host and sends them to the XorMon server on TCP port 8162, over connections initiated from the monitored Linux only.
Linux OS agent data has a sample rate of 1 minute. NFS statistics based on the nfsiostat command are listed among the OS agent additions of XorMon 2.0.0. The XorMon OS agent for Linux is written in Go and has the same functionality as the earlier Perl-based agent. It requires Linux with systemd and root privileges for installation, and is packaged as .deb for Debian and Ubuntu and as .rpm for RHEL, on x86_64, amd64, arm64 and ppc64le.
Sources: Linux monitoring, updated 2026-10-21, Linux agent installation, updated 2026-10-22, Data frequency, updated 2026-05-04, and Release notes 2.0.0.
How does XorMon store NFS data and alert on it?
XorMon keeps server data as 1 minute averages for 1 month and as daily averages for 3 years, and any metric it collects can be selected for alerting.
Server data is also kept as 5 minute averages for 3 months, 1 hour averages for 6 months and 6 hour averages for 1 year, and retentions can be adjusted without data loss. Performance alerts are configured in the UI under Settings, Alerting, Performance, with a threshold and email groups defined in advance. Email alerts include graphs by default, and alerts can also go out by SNMP trap and other integrations.
Sources: Data retention, updated 2026-05-04, Alerting, updated 2026-10-13, and Alerting integrations, updated 2026-10-22.
Key points
- Monitors NFS client performance of all mounted NFS filesystems on Linux, through the XorMon OS agent.
- Six metrics: data, IOPS, retransmissions, latency, queue wait and errors.
- Based on the nfsiostat command; agent connections go to the XorMon server on TCP port 8162.
- Server data kept from 1 minute averages for 1 month to daily averages for 3 years.
- Alerts on any collected metric, free open source license (GPL v3).
NFS client metrics and examples
The OS agent monitoring NFS client performance statistics of all mounted NFS filesystems.Data is based on command nfsiostat.
It is supported only on Linux based operating systems.
Monitored metrics
- Data [Bytes/sec]
- IOPS
- Retransmissions
- Latency [mili seconds]
- Queue wait [mili seconds]
- Errors
Examples
Data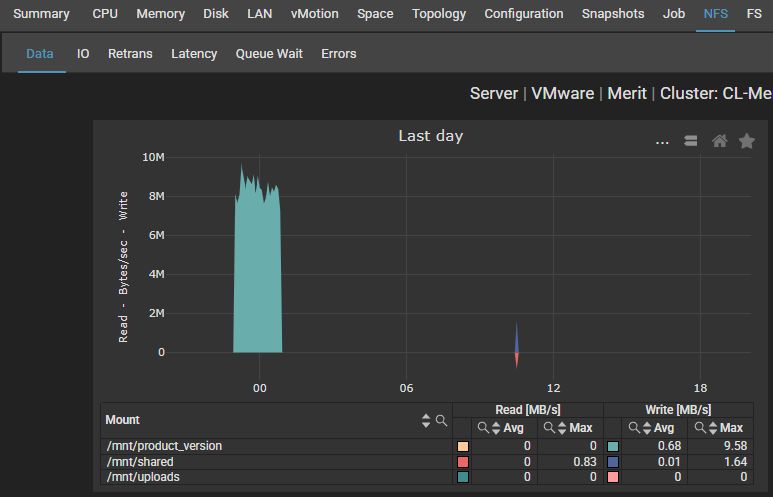 |
IOPS
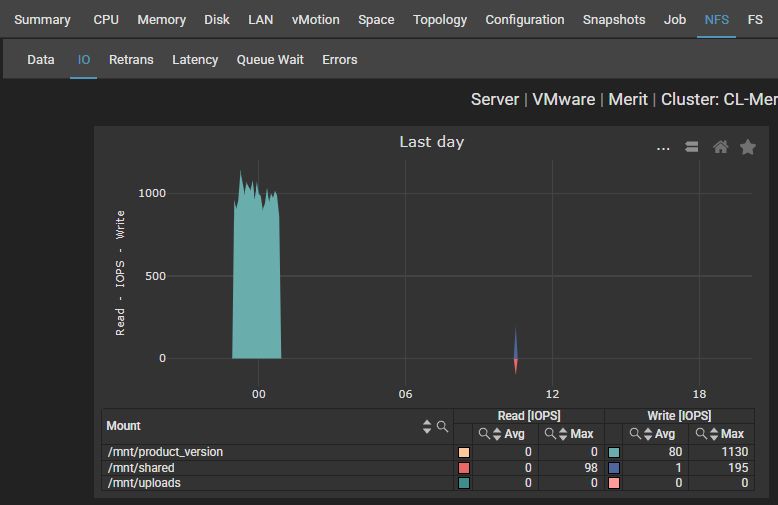 |
Latency
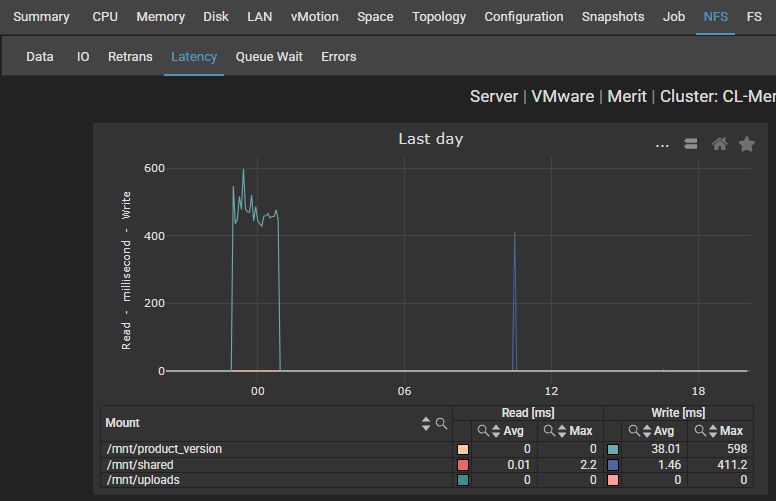 |
Queue
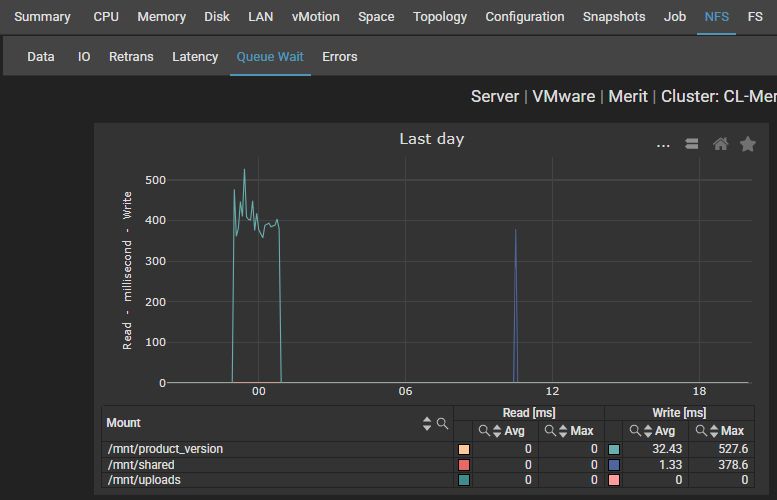 |
Last updated: