LAN monitoring
F5 Big-IP is monitored via its REST API.
Health Status:
Configuration:
Topology:
Virtual Server:
Pool:
Port:
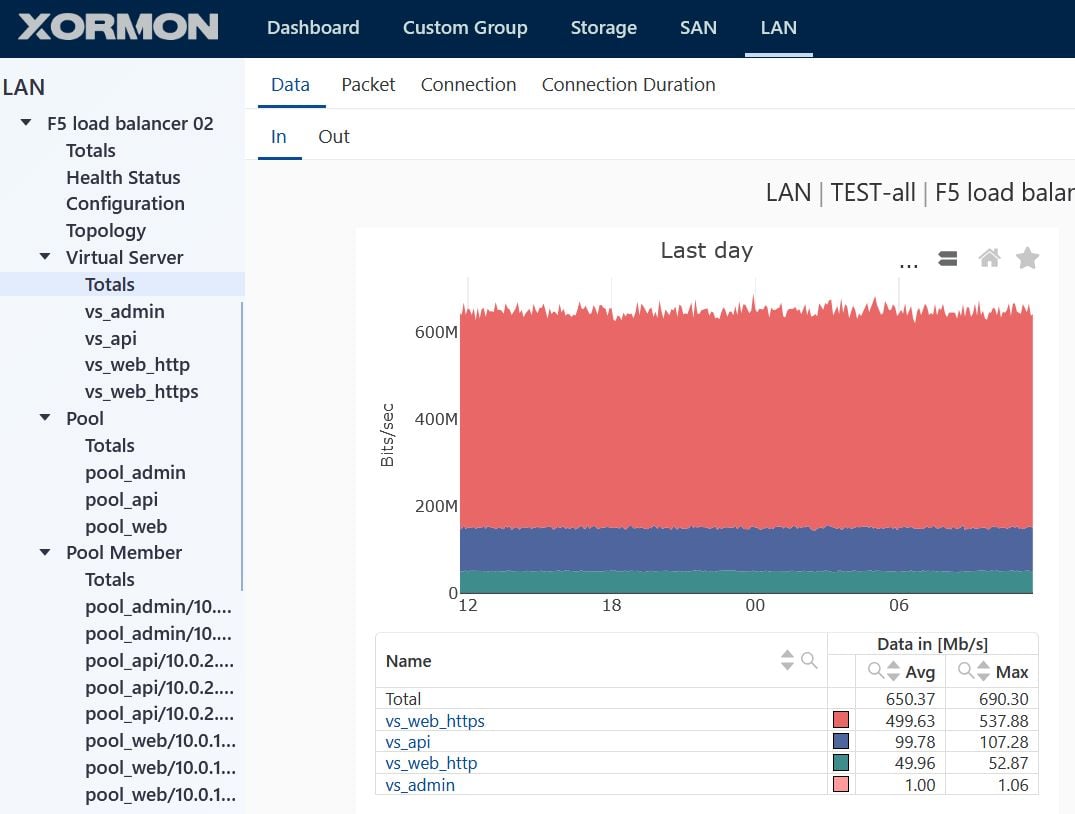
Virtual Server
- Data throughput [MB/sec, Mbit/sec]
- Packets
- Connection: active, rate
- Connection duration
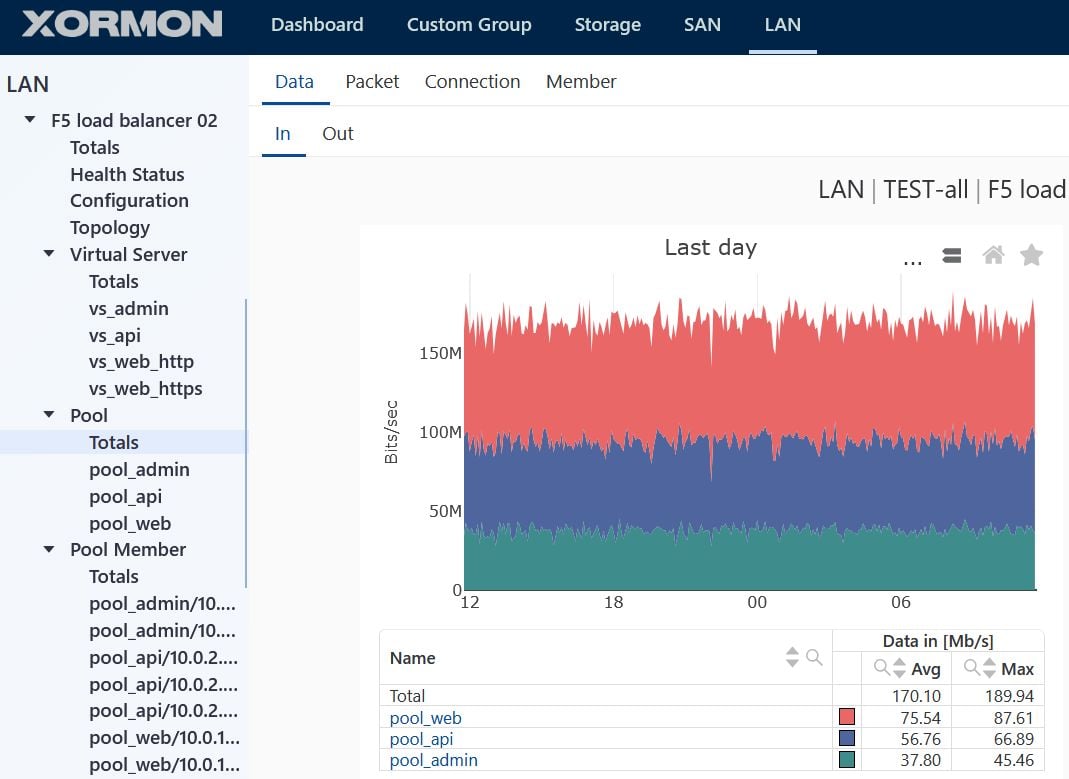
Pool
- Data throughput [MB/sec, Mbit/sec]
- Packets
- Connection active, rate
- Member: active, available
Pool member
- Data throughput [MB/sec, Mbit/sec]
- Connection active, rate
Node
- Data throughput [MB/sec, Mbit/sec]
- Packets
- Connection: active, rate
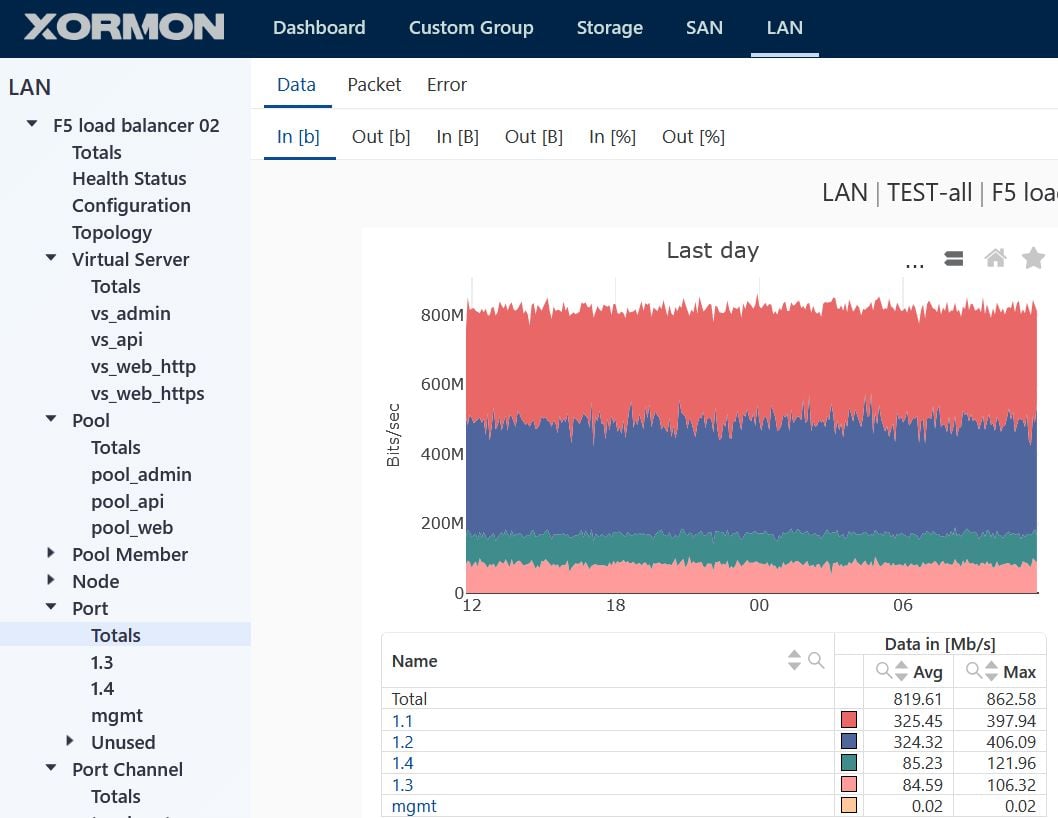
Port
- Data throughput [MB/sec, Mbit/sec]
- Packets
- Error: error, discard
Port Channel
- Data throughput [MB/sec, Mbit/sec]
- Packets
VLAN
- Data throughput [MB/sec, Mbit/sec]
System
- CPU
- Memory
Examples
Total: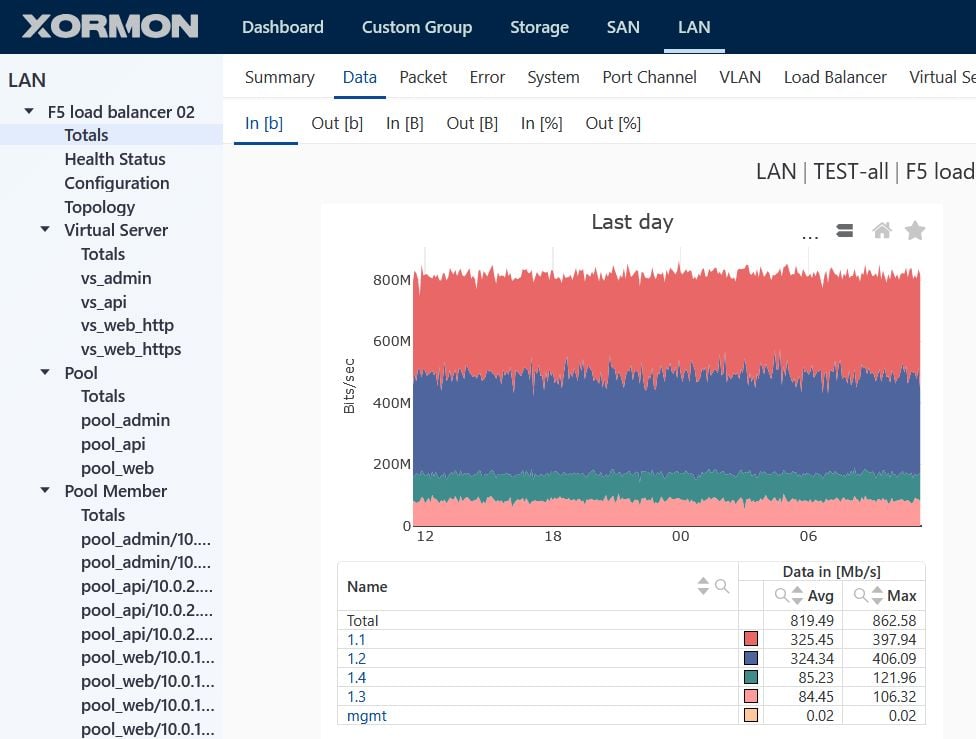 |
Health Status:
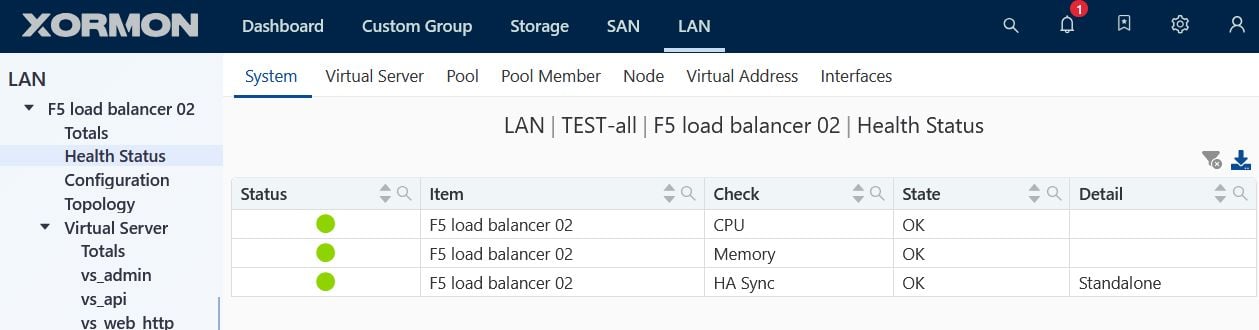 |
Configuration:
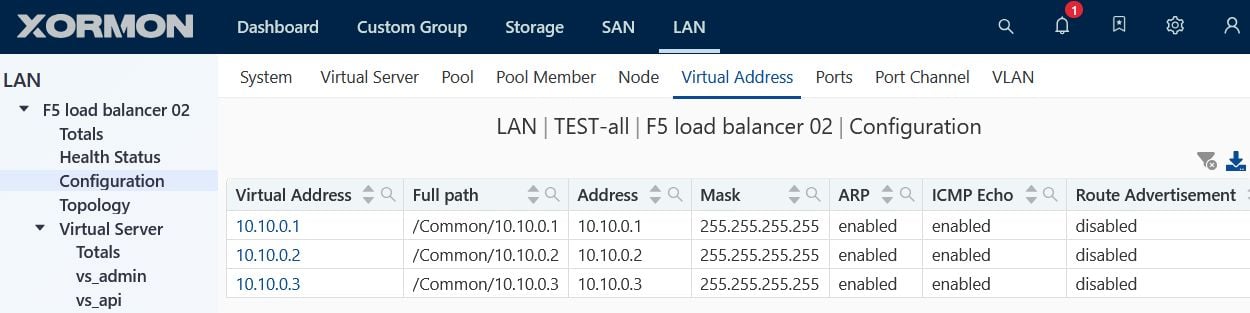 |
Topology:
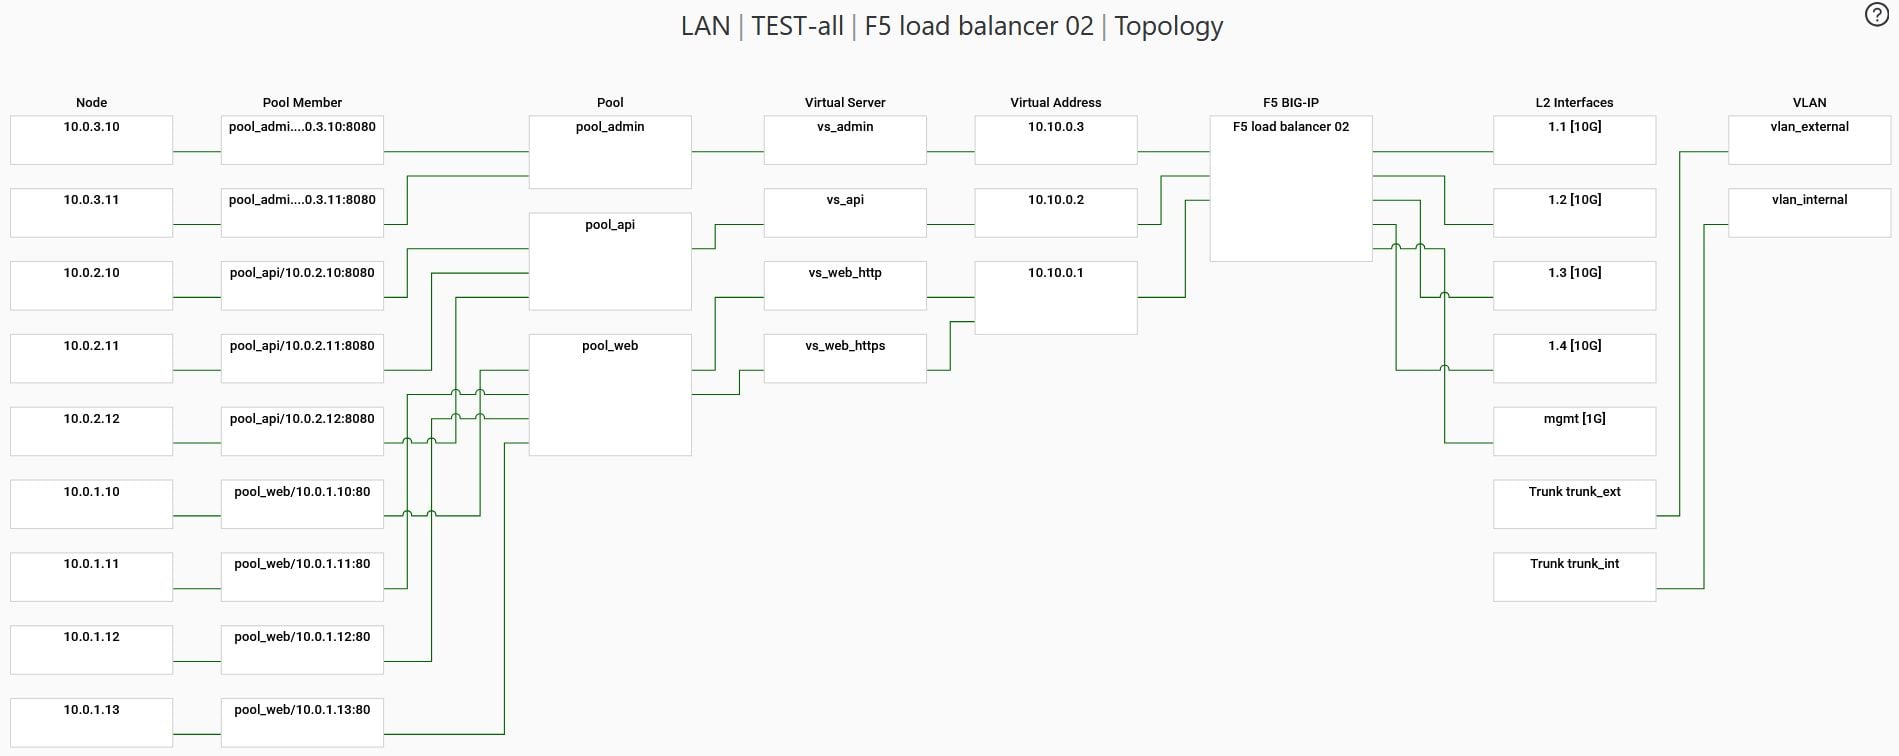 |
Virtual Server:
 |
Pool:
 |
Port:
 |
Palo Alto is monitored via its REST API.
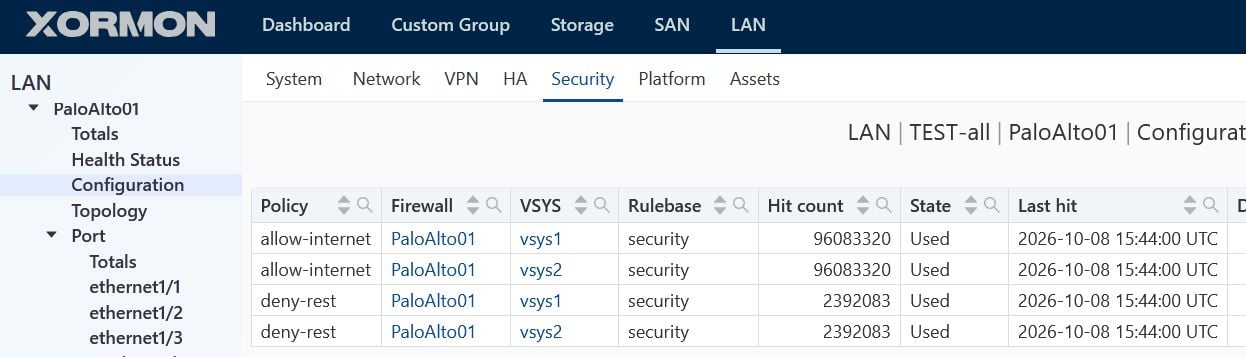
Configuration:
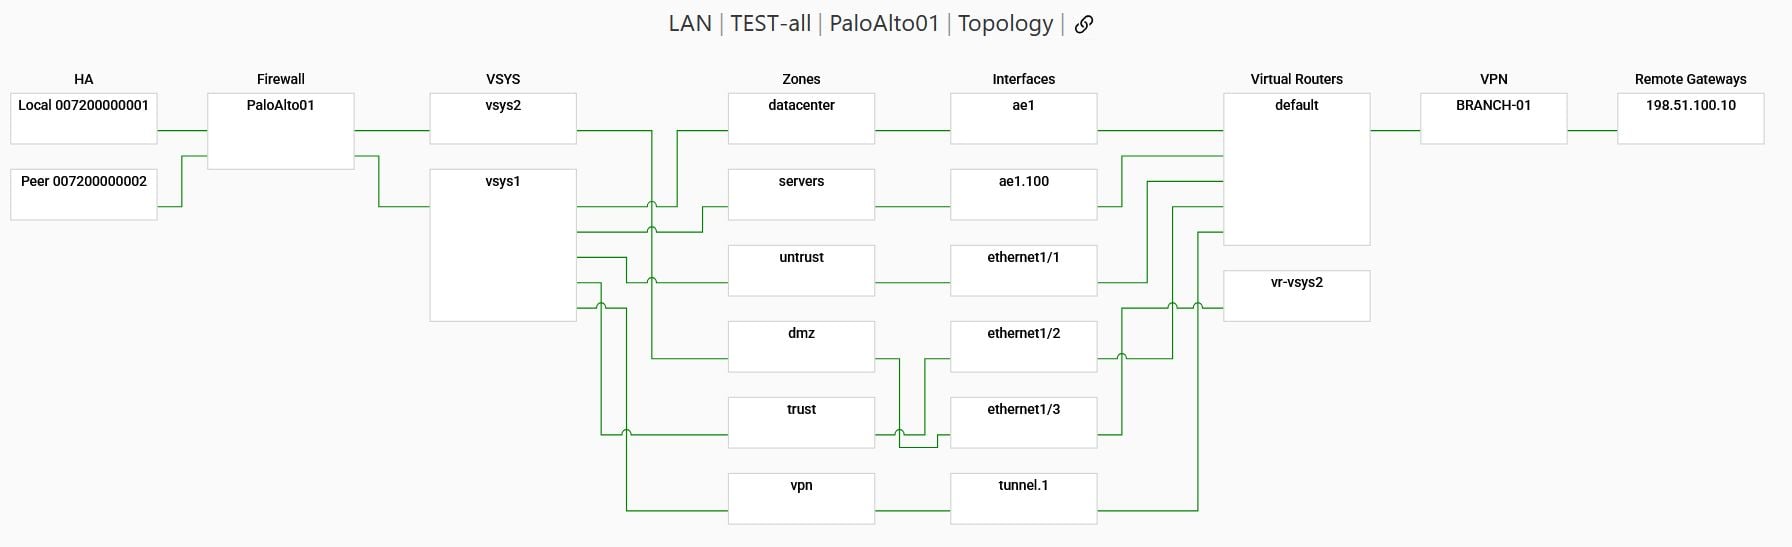
Topology:
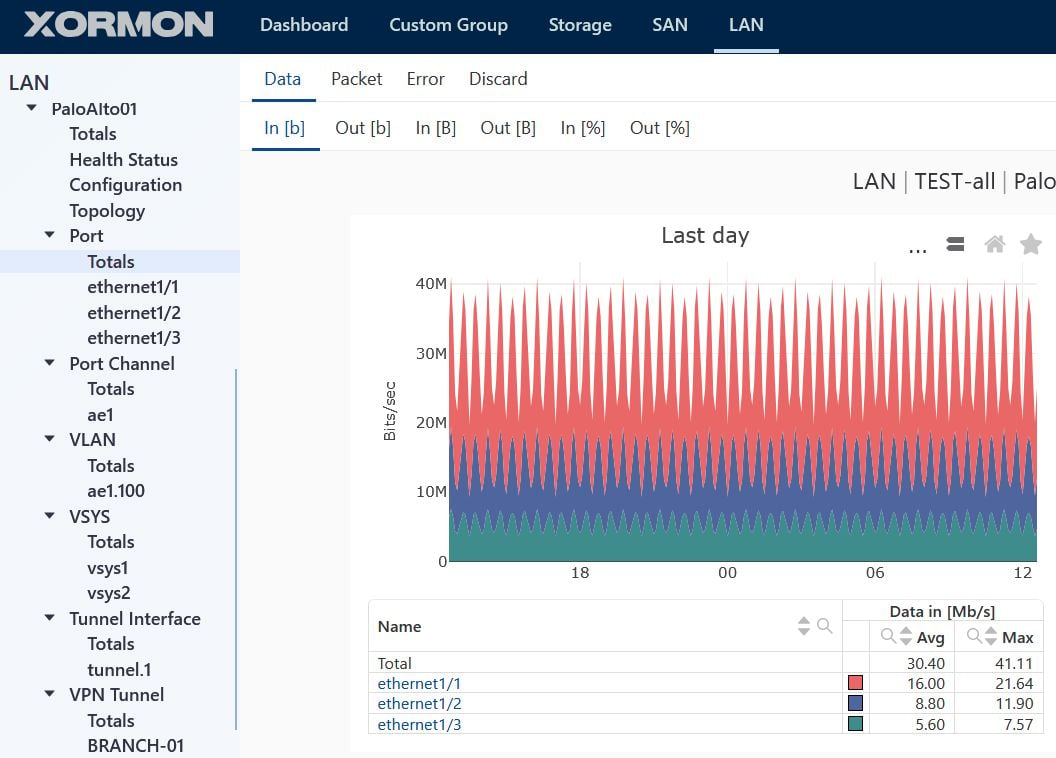
Port:
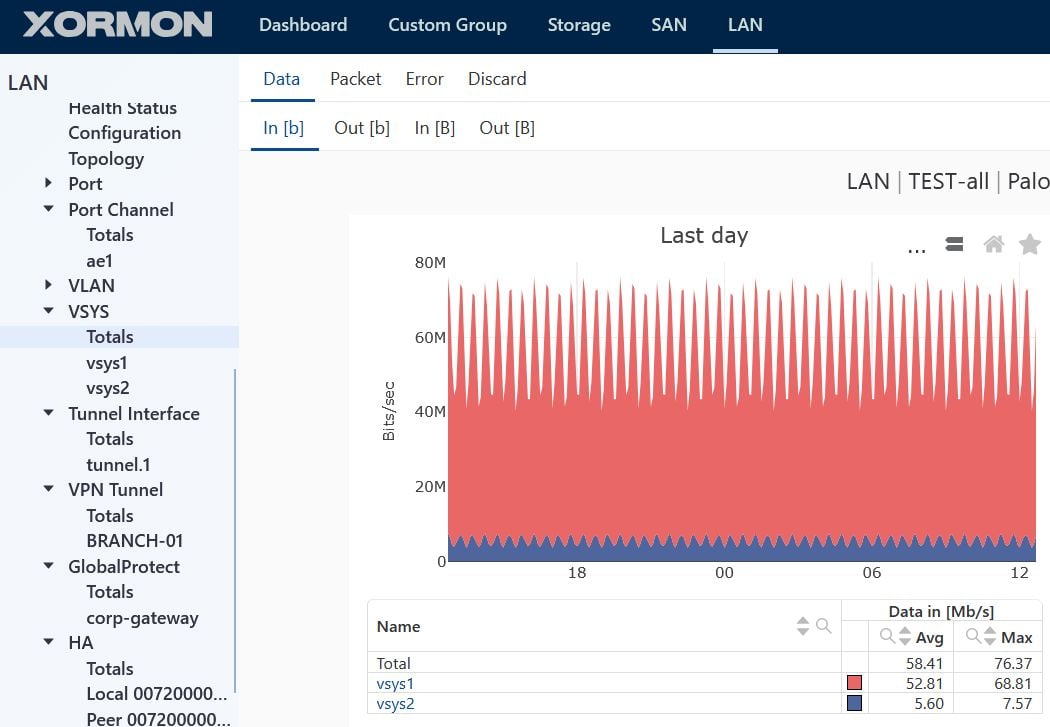
VSYS:
Monitoring scope
Port
- Data throughput [MB/sec, Mbit/sec]
- Packets
- Error
- Discard
Port Channel
- Data throughput [MB/sec, Mbit/sec]
- Packets
- Error
- Discard
VLAN
- Data throughput [MB/sec, Mbit/sec]
- Packets
- Error
- Discard
VSYS
- Data throughput [MB/sec, Mbit/sec]
- Packets
- Error
- Discard
Tunnel Interface
- Data throughput [MB/sec, Mbit/sec]
- Packets
- Error
- Discard
VPN Tunnel
- Data throughput [MB/sec, Mbit/sec]
- Packets
Global Protect
- Tunnels
- Used %
- Users
- Auth Failures
High Availability
- State
- Link-up in %
- Role changer
Data Plane
- CPU in %
- Packet buffer in %
- Descriptor packet in %
- Descriptor on-chip in %
- Packet processing lookup in %
- Packet processing fast path in %
- Packet processing slow path in %
Sensors
- Temperature
- Fan
NAT Pool
- Used in %
- Used addresses/ports
Routing peer
- Peer up
- Prefix received
- Updates/s
- Flap events
Examples
Summary: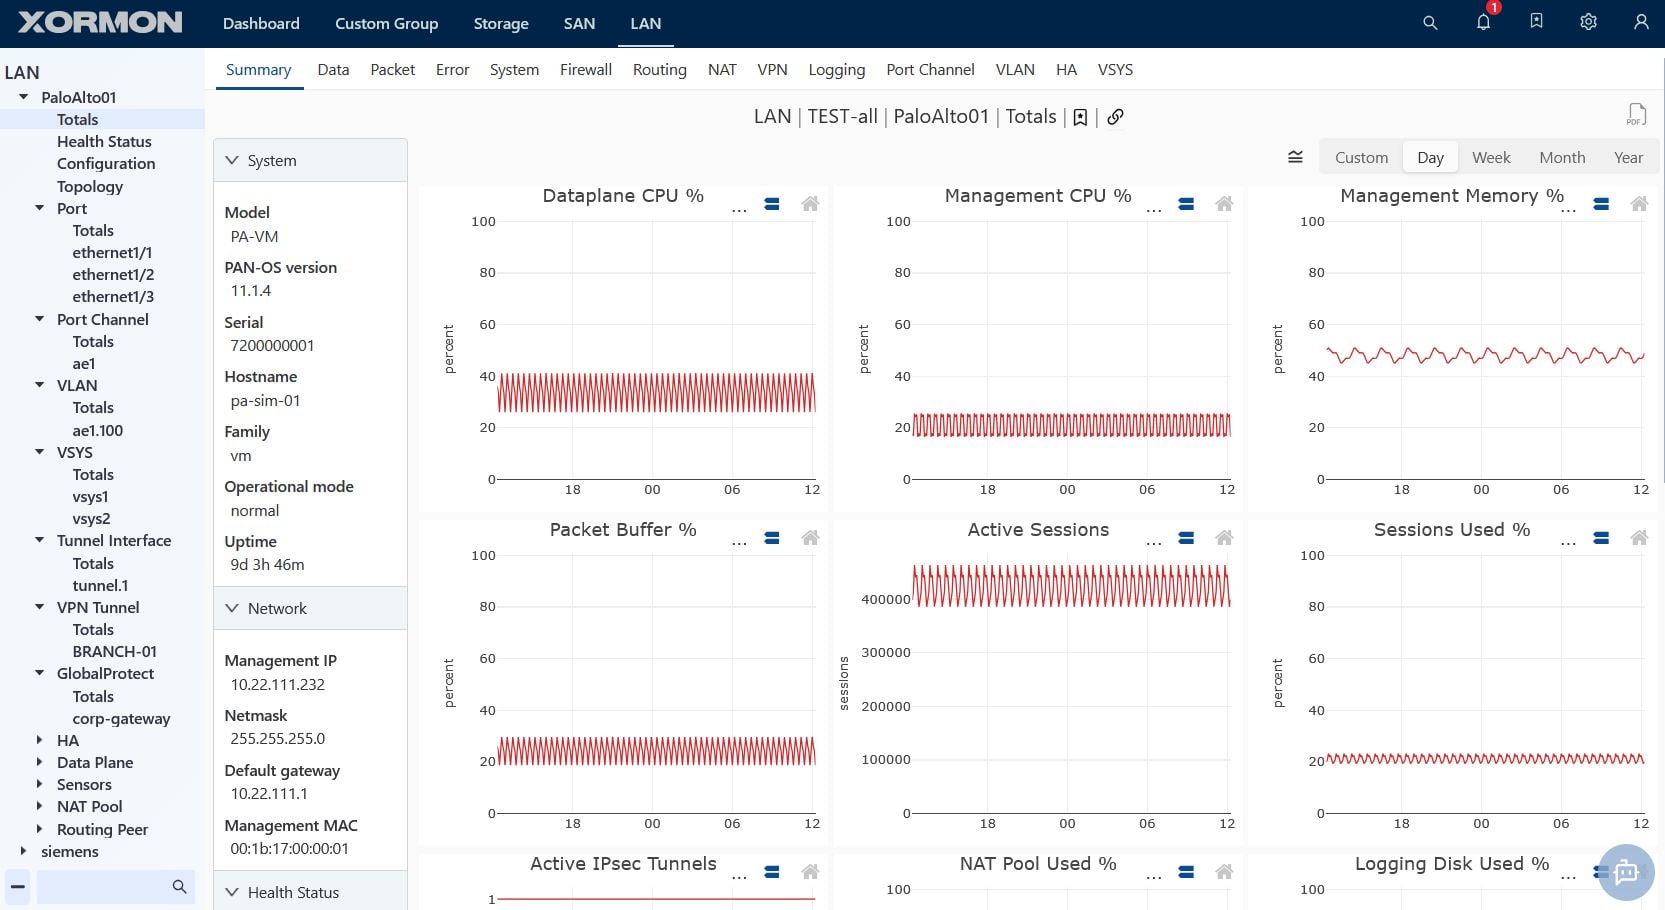 |
Configuration:
 |
Topology:
 |
Port:
 |
VSYS:
 |
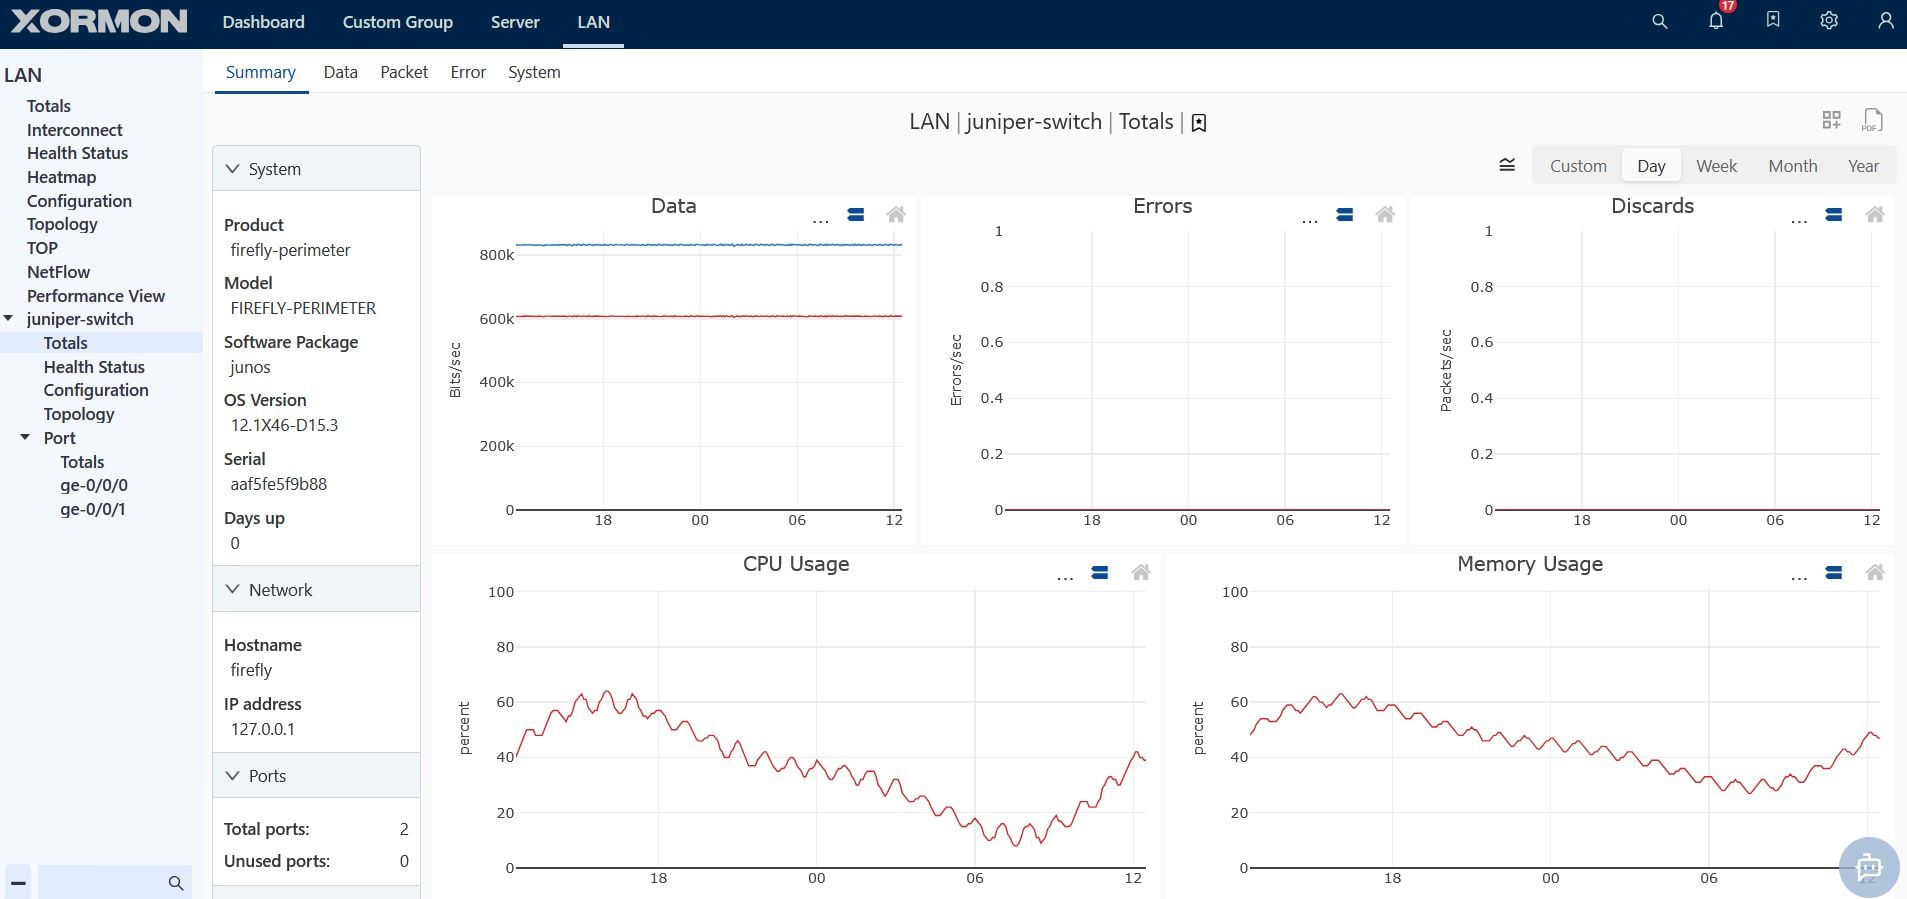 |
Monitoring scope
- Total:
- Data throughput [MB/sec, Mbit/sec]
- Packets
- Error
- Discard
- Port:
- Data throughput [MB/sec, Mbit/sec]
- Packets
- Error
- Discard
- CPU
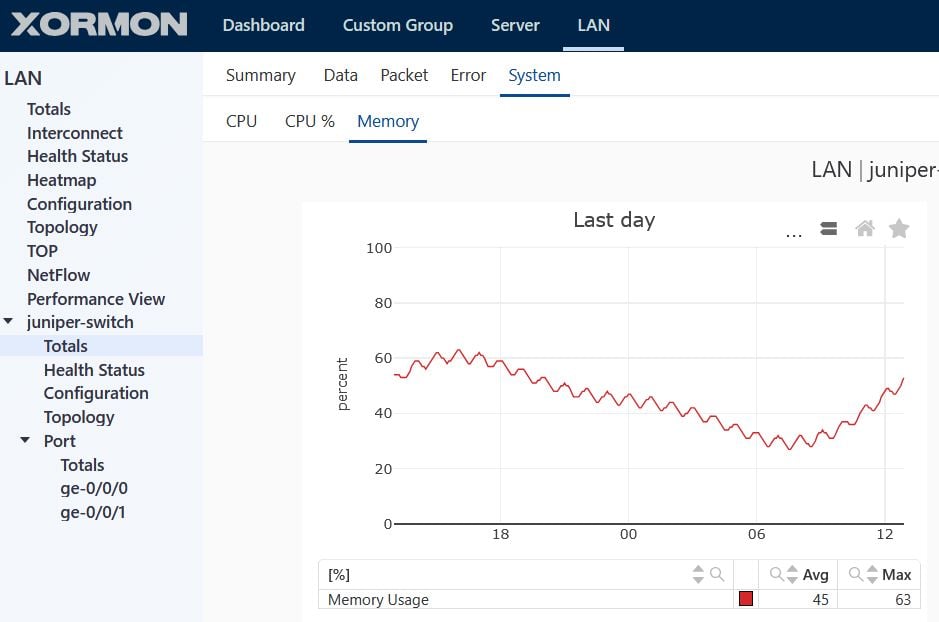
- Memory
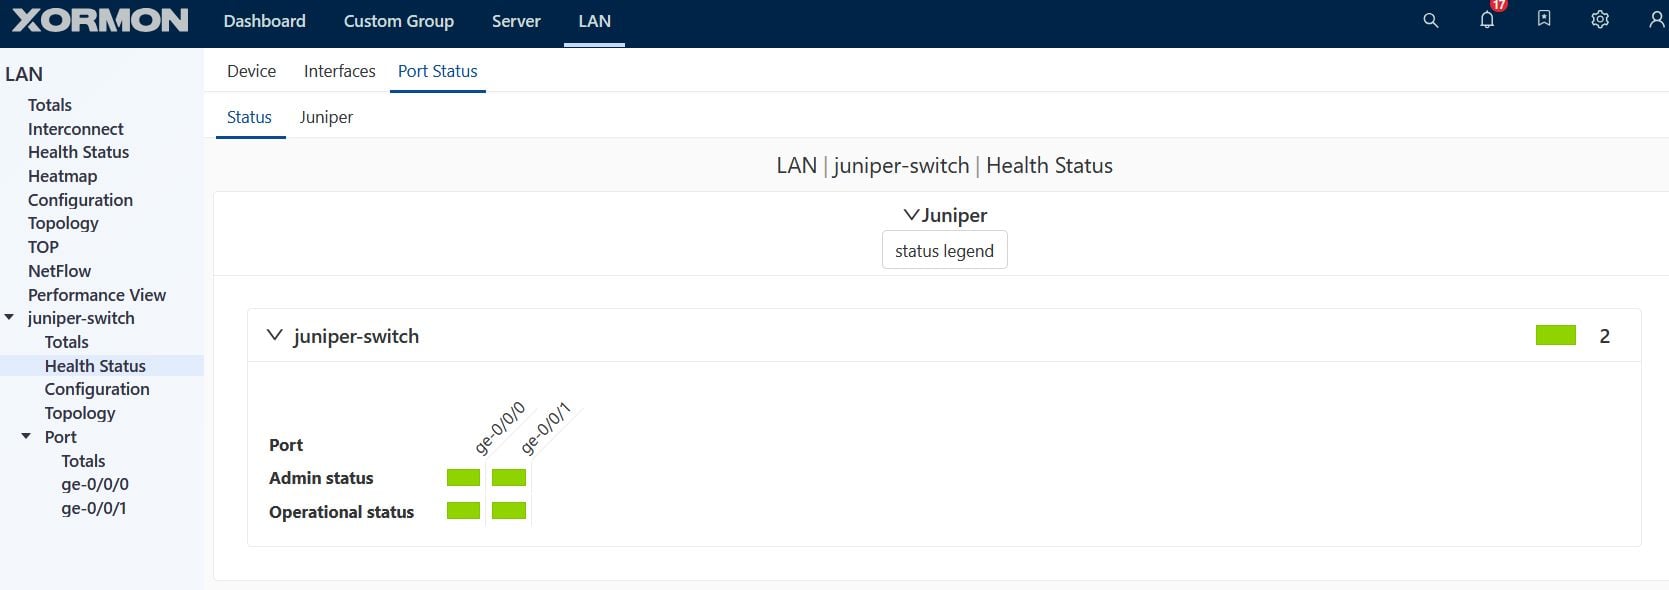
- Health status
- Configuration
Examples
CPU usage: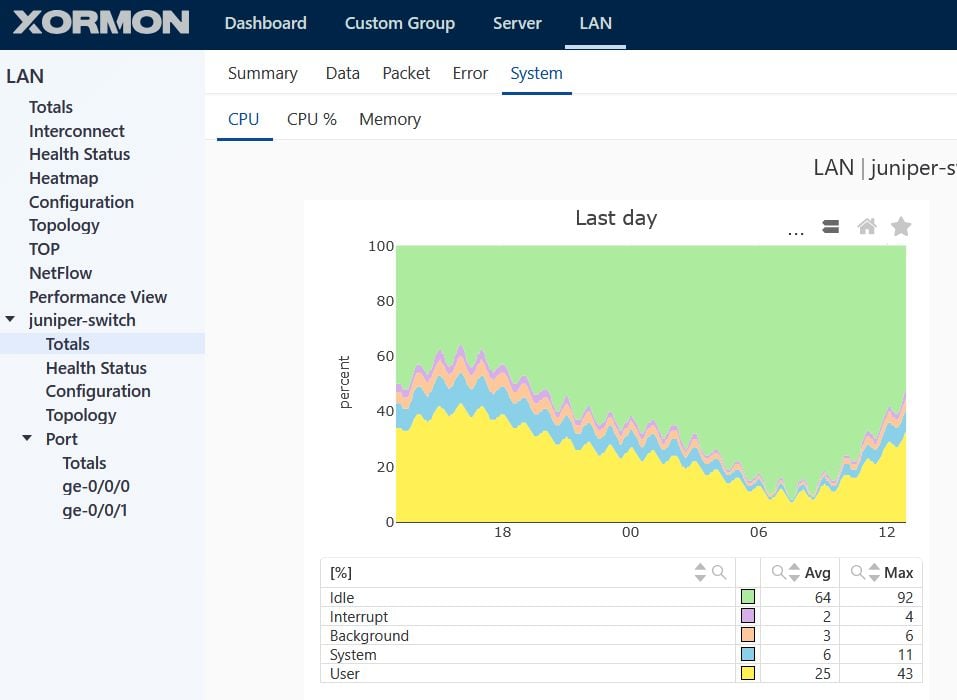 |
Memory usage:
 |
Port health status:
 |
Port configuration:
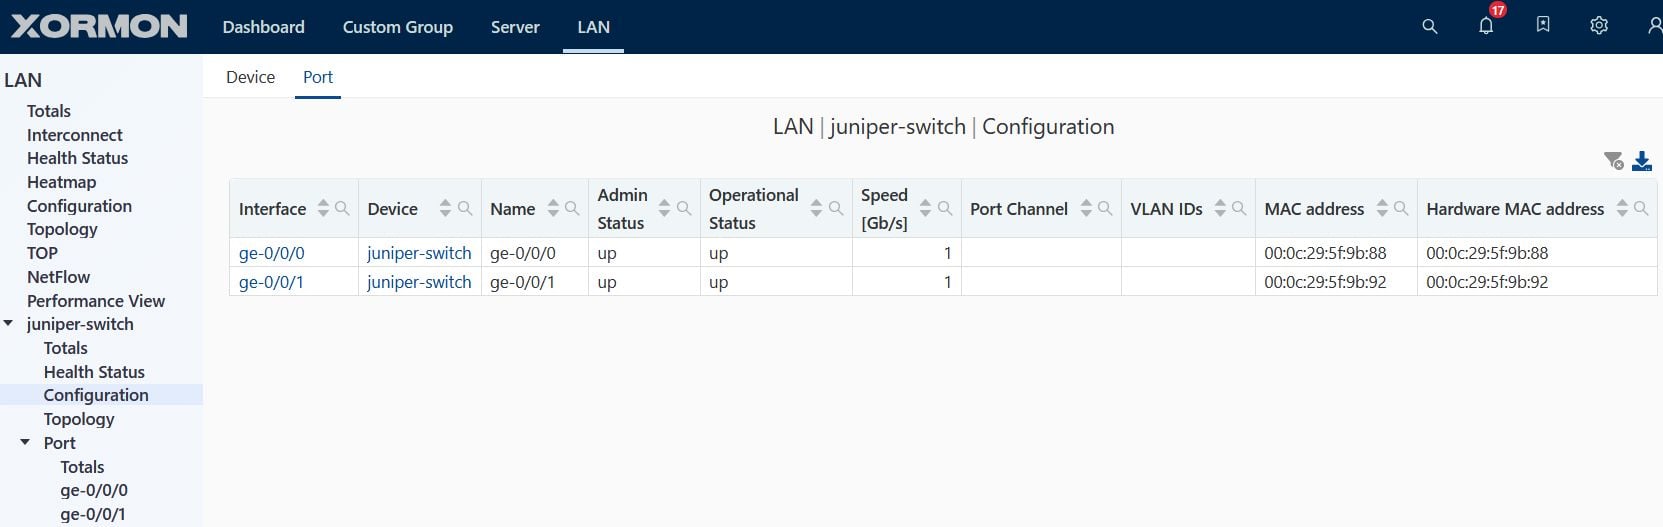 |
Supported models
- Cisco ASA 5500 Series
- Cisco ASA 5500-X Series
- Cisco Firepower 1000 Series (FPR1010, FPR1120, FPR1140, FPR1150, ...)
- Cisco Firepower 2100 Series
- Cisco Firepower 4100 Series
- Cisco Firepower 9300 Series
- Cisco Secure Firewall appliances
- Firepower Threat Defense (FTD) deployments
Supported technology
- Port-Channel
- VLAN
- Physical ports
- HA interface (Active/Standby failover)
Monitored metrics
- Data throughput [MB/sec, Mbit/sec]
- Link utilization [%]
- Packets throughput [packet/sec]
- Error packets [packet/sec]
- Discarded packets [packet/sec]
- CPU usage [%]
- Memory usage [%]
- Active connections
- Connection rate [conn/sec]
- Max connections
- Half-open connections
- NAT translations
- Packets dropped [packet/sec]
- Firewall drops [packet/sec]
- Active NAT translations
- NAT translation misses [/sec]
- IPsec tunnels active
- IKE phase-1 tunnels active
- VPN sessions (AnyConnect / Remote Access)
- SSL users
- IPsec RX/TX throughput [Mbit/sec]
- IKE RX/TX throughput [Mbit/sec]
- HA role status (Active / Standby)
- BGP peer status (up/down) per peer
- BGP updates in/out [/sec]
- BGP session established time [sec]
- Per class-map traffic in/out [bytes/sec]
- Per class-map drops [bytes/sec]
Interface metrics
System metrics
Firewall metrics
NAT metrics
VPN metrics
HA metrics (collected if available)
BGP metrics (collected if available)
QoS metrics (collected if available)
Additional features
- Display comprehensive configuration data
- Healthcheck (HW or logical issues on ports or switches)
- Historical reporting
- Alerting: performance metrics
- Alerting: HW issues
 |
Supported network devices (via SNMP)
- Cisco
- Cisco-compatible SNMP MIBs
- HPE Aruba
- Huawei
Monitored metrics
- Data throughput [MB/sec, Mbit/sec]
- Unicast packets throughput [packet/sec]
- CPU, Memory usage
- Error packets [packet/sec]
Supported technology
- Port-Channel
- VLAN
- FEX
- VSS
- Physical ports
Additional features
- LAN Topology
- Display comprehensive configuration data
- Healthcheck (HW or logical issues on ports or switches)
- Historical reporting
- Alerting: performance metrics
- Alerting: HW issues
Examples
Total: data in in bit/sec |
Total: CPU usage
 |
Total: heatmap
 |
Switch: health status
 |
 |
FortiGate and all its managed switches are monitored via FortiGate REST API.
Monitored devices
- FortiGate
- FortiSwitch
Monitored components FortiGate
- Port
- VLAN
- Port Channel
- VDOM
- VPN Tunel
- SD-WAN
- Link
- HA
- FortiAP
- CPU
- Sensors
Monitored components FortiSwitch
- Port
Monitored metrics
- Data Mbit/sec
- Packet, error
- CPU
- Memory
- Sessions
- Setup Rate
- SSL VPN (Connections, Tunels, Users)
- Latency
- Jitter
- Packet lost
- Radio data
- Temperature
- Fan
- Voltage
Examples
FortiGate Data: |
FortiSwitch summary:
 |
FortiSwitch port:
 |
FortiSwitch Health Status:
 |