MS Windows, Hyper-V monitoring
Hyper-V monitoring tracks the performance of Hyper-V clusters, cluster nodes, disks and virtual machines, and of stand-alone Windows servers. XorMon, open source under GPL v3, uses a single Windows OS agent that reads the configuration from Active Directory and the performance data through WMI, and graphs CPU, memory, paging, LAN and disk metrics.
Which Hyper-V performance metrics does XorMon monitor?
XorMon graphs CPU, memory usage, paging, LAN throughput in MB/sec, disk throughput in MB/sec and IOPS, disk latency and disk capacity. The monitored components are the Windows server, the Hyper-V cluster, the cluster node, the Hyper-V disk, the virtual machine and Microsoft Storage Spaces Direct (S2D).
CPU and memory are graphed per cluster, Hyper-V node, Windows server and VM, and the cluster also has an aggregated CPU graph. Network and disk usage are graphed per node, Windows server and VM, and disk IOPS, latency and capacity per node and Windows server. Change Tracker logs configuration changes such as the processor status and version of Windows servers and the memory and version of VMs. Microsoft Storage Spaces Direct (S2D) is monitored too, with IOPS, data throughput in MB/sec and latency per volume and per physical drive, plus volume capacity.
Sources: Feature matrix, S2D monitoring, updated 2026-05-04, and Change Tracker, updated 2026-10-19.
How does XorMon collect Hyper-V and Windows data?
A single Windows OS agent, running on any Windows host in the domain, gets the configuration from Active Directory and the performance data of the monitored hosts through WMI, and passes the data to the XorMon server.
The agent works wherever PowerShell 3 or higher is available and does not depend directly on the Windows version. It sends data over TCP port 8162, on connections initiated from the agent server to the XorMon server. It can monitor only the server where it is installed (the default), all servers visible in AD, or a list of specific servers, which is the recommended mode. Server data is kept as 1 minute averages for 1 month, 5 minute averages for 3 months, 1 hour averages for 6 months, 6 hour averages for 1 year and daily averages for 3 years, and retentions can be adjusted without data loss.
Sources: Hyper-V installation, updated 2026-05-14, Hypervisor monitoring, updated 2026-10-06, and Data retention, updated 2026-05-04.
How do you monitor a Hyper-V cluster with XorMon?
Add the cluster name and the names of all its nodes to the list of servers the agent monitors, for example cluster1,node1,node2, and give the agent user read-only rights on the monitored Hyper-V clusters.
The agent user is created in Active Directory as a member of the Event Log Readers, Hyper-V Administrators, Performance Log Users and Performance Monitor Users groups for all monitored Hyper-V nodes and Windows servers, which can be set globally in AD. It also needs local admin rights on the Windows server that runs the agent. Windows and Hyper-V clusters, servers or VMs can be placed in custom groups, which show their metrics in one place and can be used for alerts, reports and exports.
Sources: Hyper-V installation, updated 2026-05-14, and Custom groups, updated 2026-05-04.
How does XorMon help size Hyper-V VMs and alert on problems?
The Resource Configuration Advisor, which supports Microsoft Windows and Hyper-V, checks the CPU, memory and IO setup of VMs against their historical utilization, and XorMon alerting can use any metric the tool collects.
The Advisor runs once a day after midnight, collects average and peak CPU, memory and IO utilization for the last day, week and month, and suggests resource changes; the administrator decides what to apply. Ping alerting, which checks availability, supports Hyper-V VMs through the OS agent. Alerts are sent by email, SNMP trap or one of the other alerting integrations.
Sources: Resource Configuration Advisor, updated 2026-10-28, Alerting, updated 2026-10-13, Ping alerting, updated 2026-09-17, and Alerting integrations, updated 2026-10-22.
Key points
- Monitors Windows servers and Hyper-V clusters, cluster nodes, disks and VMs, plus Storage Spaces Direct (S2D).
- A single Windows OS agent reads the configuration from Active Directory and performance data through WMI.
- Graphs CPU, memory, paging, LAN throughput, and disk throughput, IOPS, latency and capacity.
- Covers a cluster once its name and the names of all its nodes are added to the agent configuration.
- Resource Configuration Advisor, threshold and ping alerts, free open source license (GPL v3).
Monitoring scope and agent compatibility
 |
XorMon is able to monitor stand-alone Microsoft Windows servers, Microsoft Hyper-V and Microsoft Storage Spaces Direct (S2D) performance metrics.
Implementation is done through single Windows OS agent running on any Windows host in the Windows domain.
This OS agent gets all required configuration from the AD and performance data of monitored hosts through WMI.
It passes such data to XorMon server.
Monitored components
- MS Windows server
- Hyper-V Cluster
- Hyper-V Cluster node
- Hyper-V Disk
- Hyper-V Virtual Machine
- Microsoft Storage Spaces Direct (S2D)
Monitored metrics
- CPU
- Memory utilization
- Paging
- LAN throughput MB/sec
- Disk throughput MB/sec
- Disk throughput IOPS
- Disk latency
- Disk capacity
Microsoft S2D monitored metrics
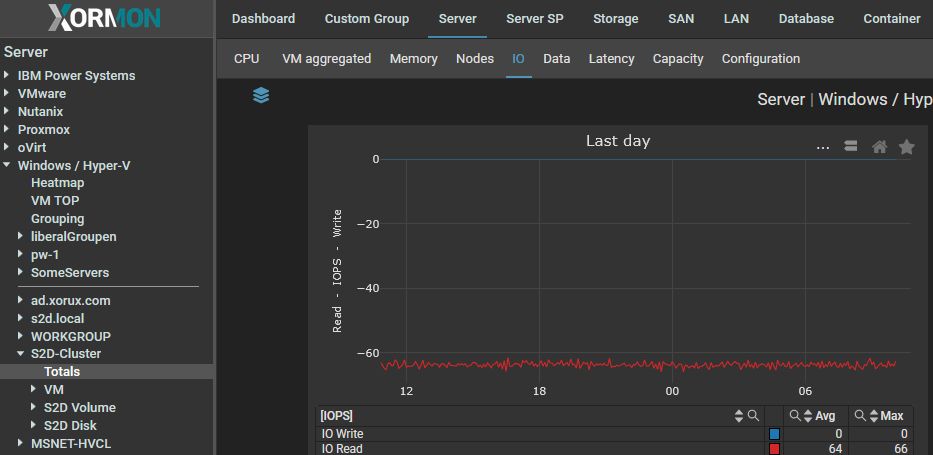
- Volume IOPS
- Volume Data MB/sec
- Volume Latency
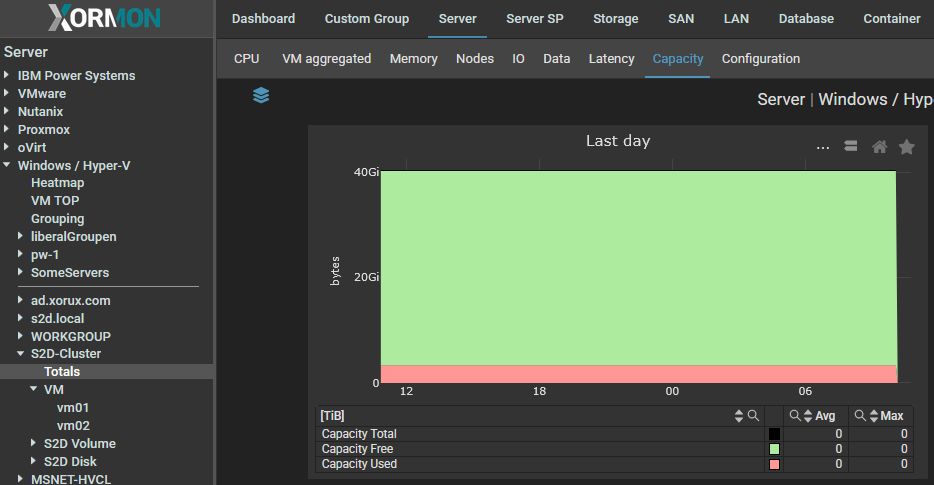
- Volume Capacity
- PhysicalDisk(Drive) IOPS
- PhysicalDisk(Drive) Data MB/sec
- PhysicalDisk(Drive) Latency
S2D Examples
 |
 |
Agent compatability
LPAR2RRD Windows OS agent works everywhere where is available PowerShell 3 and higherIt does not directly depends on Windows version, if you are able to upgrade PowerShell to 3.0+ on older Windows machines then it will work.
Last updated: