VMware Monitoring
VMware monitoring tracks the performance and usage of vCenter, clusters, resource pools, ESXi hosts, virtual machines and datastores. XorMon, open source under GPL v3, collects this data from the vCenter REST API and graphs CPU usage include CPU Ready and CPU Co-Stop, memory, network and disk performance with latency, disk usage, snapshots and vSAN metrics.
What does VMware monitoring cover in XorMon?
XorMon monitors vCenter, clusters, resource pools, datastores, ESXi hosts and virtual machines, and adds vSAN, snapshots and a topology map of VMs, datastores and storage volumes.
Beyond the performance graphs, the VMware section offers the Resource Configuration Advisor, historical reporting, custom groups, heatmaps, trends and graphical tracking of vMotion. VM migration tracking shows how a virtual machine moved between physical servers and how the move affected its CPU utilization. Alerts can be set on any metric the tool collects, and an event alert is sent when a device turns red in the global health status dashboard.
Sources: VM migration, updated 2026-05-04, and Alerting, updated 2026-10-13.
Which VMware performance metrics does XorMon collect for CPU, memory, disk and network?
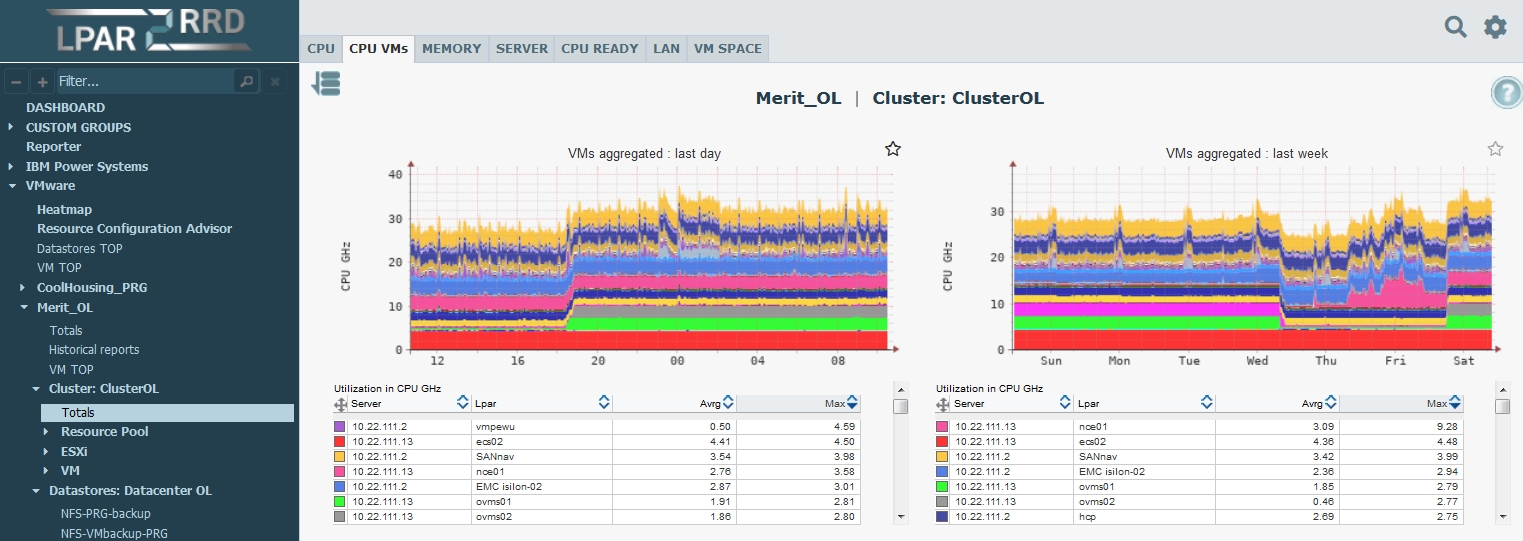
XorMon graphs CPU usage in cores, in % and in GHz, CPU Ready and CPU Co-Stop, memory usage, LAN throughput in MB/sec, disk performance in MB/sec, IOPS and latency in ms, and disk usage in GB.
Memory is shown as reserved, granted, consumed, active, balloon, swap in and limit. CPU Ready is the percentage of time a virtual machine is ready to run but cannot be scheduled on a physical CPU; the CPU monitoring page notes that under 5% is typically not an issue and that above 10% the impact becomes significant. Co-Stop is the percentage of time a VM with more than one vCPU was ready to run but was delayed by co-vCPU scheduling contention.
Source: VMware CPU monitoring, updated 2026-05-04.
How does XorMon monitor VMware datastores and vSAN?
XorMon monitors the configuration and performance of VMware datastores, including vSAN based datastores, and shows the logical connections between virtual machines, datastores and storage volumes.
For vSAN, it graphs MD and SSD capacity in TiB and in %, configuration and outstanding IO at the vCenter level, and IOPS, data in MB/sec, latency in ms and congestion per cluster. The VMware Topology view shows the logical connections between virtual machines, datastores and storage volumes, with an overview, an all connections view and a custom view; clicking a VM highlights its path to the datastore and the storage volume.
Sources: VMware vSAN monitoring, updated 2026-06-23, and VMware Topology, updated 2026-05-04.
How does XorMon collect data from vCenter?
XorMon reads data from the vCenter REST API with a read-only user over HTTPS (TCP port 443). VMware data is sampled every minute and collected every 60 minutes.
The vCenter user, for example [email protected], gets the read-only role with "Propagate to children" checked; on older vCenters it must be a global user. Server data is kept as 1 minute averages for 1 month, 5 minute averages for 3 months, 1 hour averages for 6 months, 6 hour averages for 1 year and daily averages for 3 years, and retentions can be adjusted without data loss.
Sources: VMware installation, updated 2026-05-15, Data frequency, updated 2026-05-04, and Data retention, updated 2026-05-04.
Key points
- Monitors vCenter, clusters, resource pools, datastores, ESXi hosts and VMs, plus vSAN and snapshots.
- Collects data from the vCenter REST API with a read-only user, sampled every minute and collected every 60 minutes.
- Graphs CPU usage, CPU Ready and Co-Stop, memory, LAN and disk performance with latency, and disk usage.
- Shows the logical connections between VMs, datastores and storage volumes.
- Alerts on any collected metric, free open source license (GPL v3).
To see how XorMon and VMware Aria Operations (now VCF Operations) divide the work, read the VMware Aria Operations comparison.
Supported resources, metrics and features
It gets data from the vCenter.
Monitoring Resources
Monitoring Metrics
- CPU performance
- Memory usage (reserved, granted, consumed, active, baloon, swap in, limit)
- LAN performance in (MB/sec)
- Disk performance (MB/sec, IO per sec, latency in ms)
- Disk usage (GB)
Other Monitoring Features
- Resource Configuration Advisor
- Historical Reporting
- Custom Groups
- Heatmap
- vMotion graphical tracking
- Trends
OS Agent
Collected data set can be enhanced about OS agent which brings these additional monitoring metrics:| OS CPU | CPU sys, user, IO wait |
| CPU queue | Load avrg, Blocked processes |
| JOB | CPU, Memory |
| Memory utilization | Used, FS cache |
| LAN (ethernet adapters) | MB/sec, packet count, errors |
| SAN (FC,vSCSI adapters) | MB/sec, packets/sec, Latency, errors |
| Paging space utilization | Usage in % |
| Paging rate | MB/sec |
| Filesystem usage | Usage in %, GB |
| Error log | errpt |
| LVM | filesystem, VG, LV, disk, storage, volume |
| Disk multipath | disk |
New to the terms used on this page? See the glossary entries for datastore and vSAN.
Last updated: