Dashboard
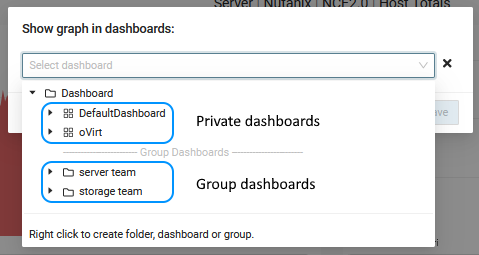
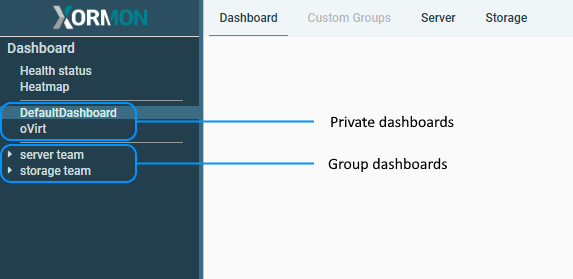
Group Dashboards allow users in the same group to share dashboards.
All users in the same group can view, create, and edit dashboards for that group.
This allows users to have both private and shared dashboards.
Example:
The user "karen" is in two groups: "server team" and "storage team".
Karen can decide where she wants to pin the graph - to her private dashboard or to the group dashboard.
Karen can also pin one graph to multiple dashboards in different groups.
All users in the same group can view, create, and edit dashboards for that group.
This allows users to have both private and shared dashboards.
Example:
The user "karen" is in two groups: "server team" and "storage team".
Karen can decide where she wants to pin the graph - to her private dashboard or to the group dashboard.
Karen can also pin one graph to multiple dashboards in different groups.
 |
 |
Graph Builder
Graph Builder allows users to create their own graphs and place them on the dashboard.Go to Dashboard -> Manage (top right)
Switch to the Graph Builder tab and select the technology in the subtab
Enter a name for the graph, select its location on the Dashboard, HW Type, and Subsystem
Use the Item Select tool to select the items the graph should contain
You can also use a regular expression to select items.
Regular expressions ensure that the graph always contains the most current items, even if old ones are deleted and new ones are created.
Select whether you want to create a Single graph or a Graph per item.
- Single Graph
Creates a single graph that includes all selected items and metrics.
A single graph is suitable for multiple items with a single metric, or for aggregating the values of many items (sum, average).
- Graph per Item
Creates a separate graph for each item.
Graph Builder allows you to add multiple metrics with the same unit to a graph.
For each metric, you can select a display type:
- Line - unstacked lines
- Area - stacked area
- None - the metric will be plotted for each item
- Sum - the sum of values for the given metric across all items
- Avg - the average value for the given metric across all items
When the result is a single line or area, you can select a custom color for the metric.
Examples
Single graphCreate a graph for all VMs whose names begin with "NG Test [number]" and
display the CPU utilization in Hz as a line for each VM.

|

|
Change aggregation to Sum and show as area

|
Preview

|
Graph per item
Create a graph for all Lenovo DE volumes whose names begin with "SAN-" and
display the read and write latency for each one.
Display each volume in a separate graph.

|
View graphs on Dashboard

|
The dashboard is empty by default.
It is up to users to select and place graphs into the dashboard.
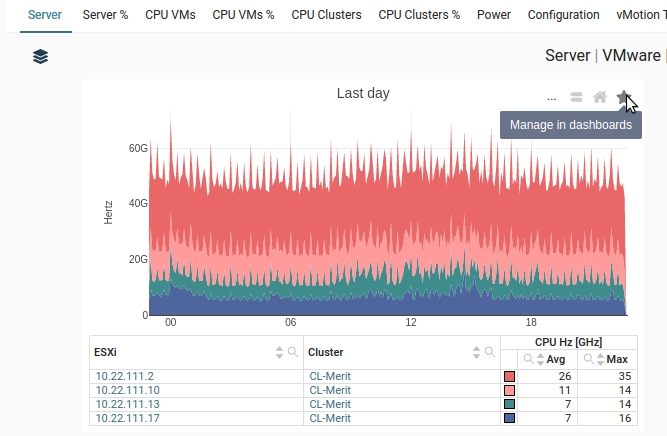
Each graph has a star on its top-right, clicking it opens a dialog for adding the graph into the dashboard.
The user can create new dashboard tabs and groups, folders, subfolders and add graphs into them.
The dashboard is fully customizable, you can:
Dashboard setup is defined per user.
(This is not available in the Summary pages)
Use the contex menu (right click) and create a new dashboard
Enter dashboard name
It appears in the menu, select it
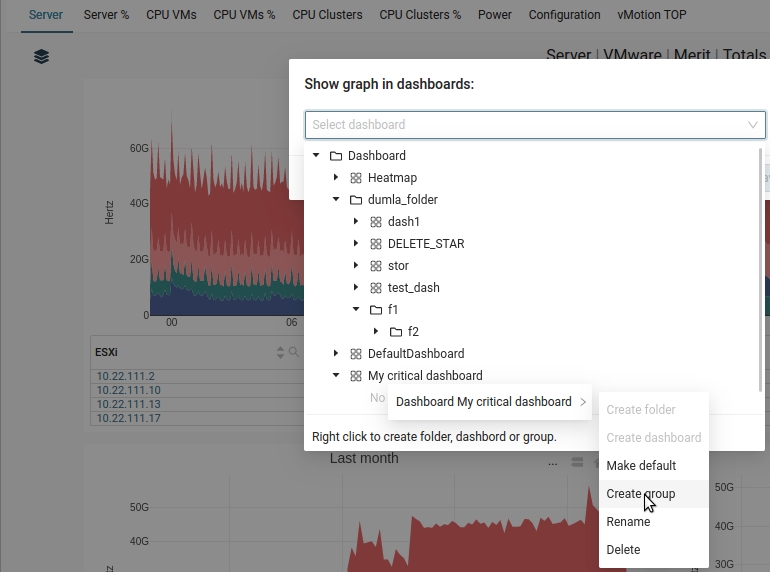
On the right click create a group
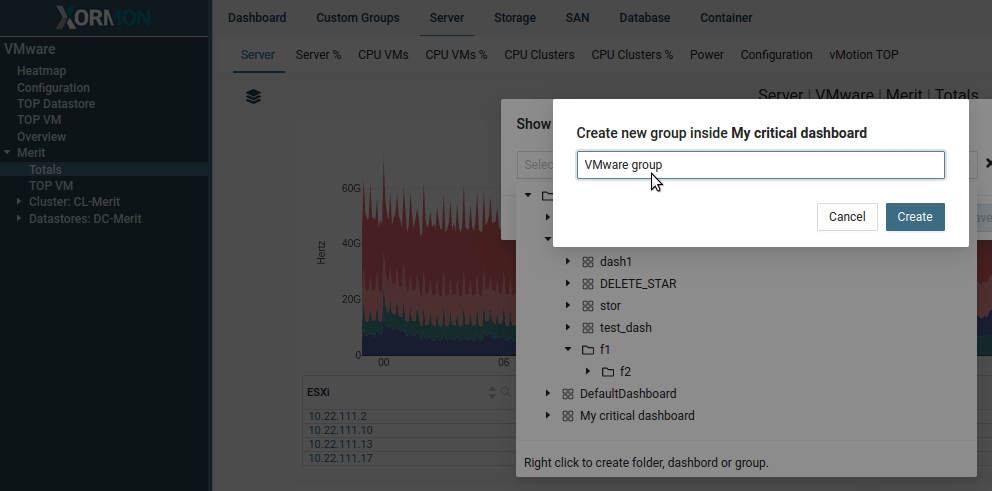
Enter group name
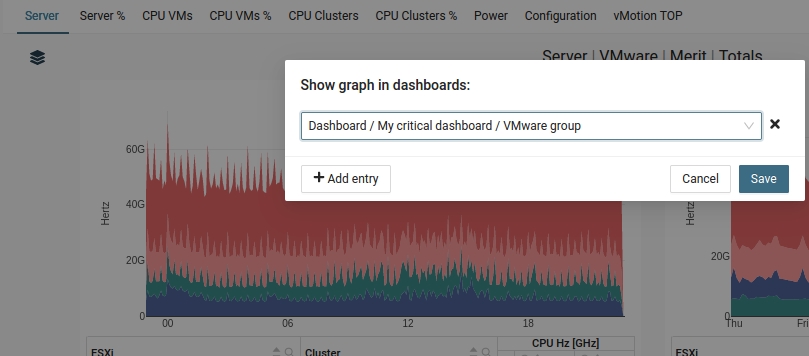
Save
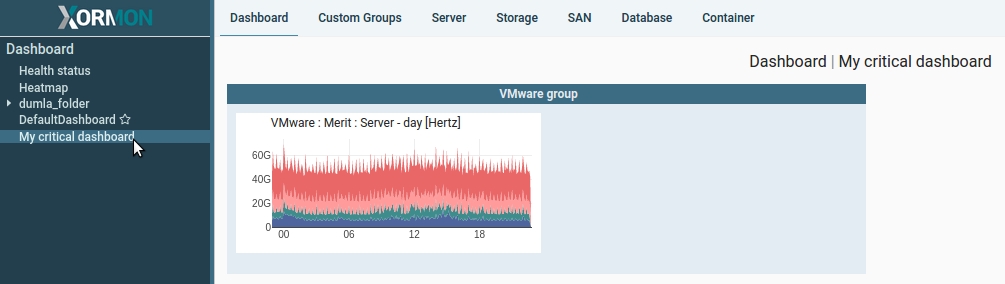
Result
It is up to users to select and place graphs into the dashboard.
Each graph has a star on its top-right, clicking it opens a dialog for adding the graph into the dashboard.
The user can create new dashboard tabs and groups, folders, subfolders and add graphs into them.
The dashboard is fully customizable, you can:
- Create a new tab
- Create a new group
- Move graphs between groups (drag&drop)
- Resize graphs (drag&drop)
- Resize groups (drag&drop)
- Share dashboards between users
- Share dashboards between user groups
Dashboard setup is defined per user.

|
How to create a new dashboard
Select a graph and click on the star on the top right(This is not available in the Summary pages)
|
Use the contex menu (right click) and create a new dashboard

|
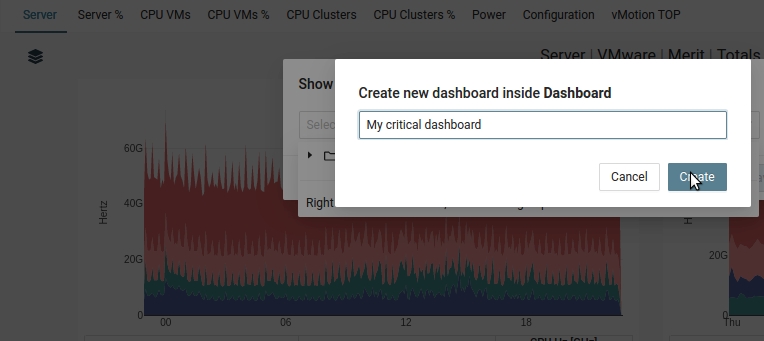
Enter dashboard name
|
It appears in the menu, select it

|
On the right click create a group
|
Enter group name
|
Save
|
Result
|