Oracle DB Monitoring
Oracle Database monitoring with XorMon tracks the configuration, health and performance of standalone, RAC, multitenant and Data Guard databases. XorMon, open source under GPL v3, collects data through SQL*Plus without requiring Oracle Diagnostics Pack or Tuning Pack and graphs CPU, IO, sessions, waits, latency, services, SQL queries, ASM disk groups and RAC global cache.
What does Oracle Database monitoring cover in XorMon?
XorMon supports standalone, RAC, multitenant and Data Guard Oracle databases and shows their configuration, from SGA and tablespace size to installed components and PSU and patches, next to their performance metrics.
For multitenant databases, the Collected Metrics table below separates the container database (CDB) from pluggable databases (PDB). Health status is listed for standalone and RAC databases, and RAC databases add interconnect and global cache metrics. The feature matrix has an Oracle tab with the same table. Per the installation guide, PSU and patches information is not available from databases older than 12c.
Sources: Feature matrix, Oracle tab, and Database installation, updated 2026-10-06.
Which Oracle Database performance metrics does XorMon collect?
Besides health status, the Collected Metrics table has 18 subsystems, from configuration, CPU, IO, sessions, wait class and latency to services, SQL query, ASM disk groups, ASM disks and Data Guard.
Session covers current logons, logons per second, blocking, long running and longest block sessions, and Data Guard covers configuration, destination, apply lag and gap. ASM disks show used and free capacity, read and write IOPS, latency and IO errors; when the storage behind the ASM disks is also connected to XorMon, each ASM disk gets its topology path to its back-end storage volume. XorMon 2.4.0 added the ASM, session, service, SQL query, wait class and Data Guard subsystems, and a SQL statements view that ranks SQL jobs by CPU time every 5 minutes.
Sources: Feature matrix, Oracle tab, Oracle ASM monitoring and Oracle SQL statements monitoring, updated 2026-10-13, and Oracle DB monitoring in XorMon 2.4.0, updated 2026-09-10.
How does the XorMon Oracle Database monitoring tool collect data?
XorMon connects to each Oracle instance through SQL*Plus and Oracle Instant Client installed on the XorMon server, with a database user that has create session and select rights on specific sys.* tables.
The installation guide states that Oracle Instant Client 19c supports Oracle Database 11.2.0.4 and newer. The default port for Oracle DB sessions is 1521. Each database is added in the XorMon UI under Device, Database, Oracle DB, New; for RAC, each node is added with its virtual IP, not the SCAN IP. For Data Guard, extra rights are granted on the primary database only. The Free edition attaches one Oracle RAC instance, with no limit for standalone instances.
Source: Database installation, updated 2026-10-06.
How does XorMon store Oracle Database data and alert on it?
Oracle DB data is collected every 5 minutes, kept as 5 minute averages for 3 months and as daily averages for 3 years, and any collected metric can be used for alerting.
Retentions can be adjusted without data loss. Performance alerts are configured under Settings, Alerting, Performance, with a threshold and email groups defined in advance, and can also go out by SNMP trap, ServiceNow, Zabbix, Discord or Telegram. Oracle DB instances can be grouped in a custom group.
Sources: Data frequency, Data retention and Custom groups, all updated 2026-05-04, Alerting, updated 2026-10-13, and Alerting integrations, updated 2026-10-22.
Key points
- Monitors standalone, RAC, multitenant and Data Guard Oracle databases through SQL*Plus.
- No Oracle Diagnostics Pack or Tuning Pack required, only a database user with view only permissions.
- 18 metric subsystems, from CPU, sessions and wait class to services, SQL query, ASM and RAC global cache.
- Data collected every 5 minutes, 5 minute averages kept 3 months, daily averages 3 years.
- Alerts on any collected metric, free open source license (GPL v3).
Oracle Database monitoring setup and metrics
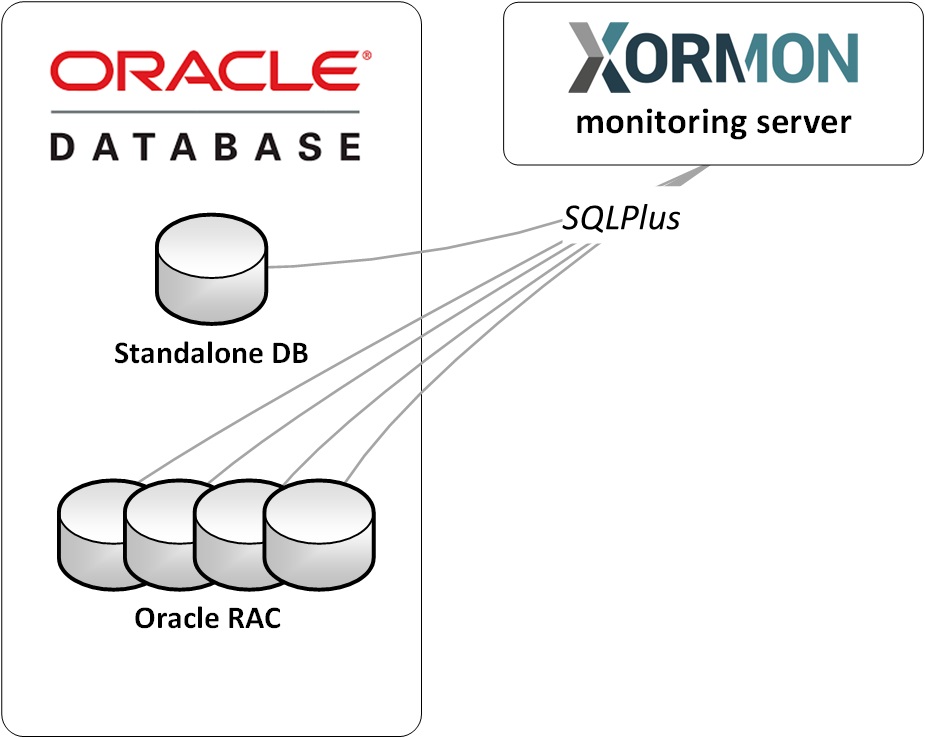 |
XorMon obtains data through SQL (SQL*Plus). Oracle client must be installed on XorMon server.
Monitoring implementation does not require any Oracle licensed features like Oracle Diagnostics Pack or Oracle Tuning Pack .
XorMon requires a database user with the following view only permissions to collect monitoring data:
- create session
- select rights on specific sys.* tables
Supported databases
- RAC
- Standalone
- Multitenant
- DataGuard
Collected Metrics
| Subsystem | Metric | Standalone | RAC | Multitenant | |
|---|---|---|---|---|---|
| Health status | yes | yes | CDB | PDB | |
| Configuration | Overall | yes | yes | yes | yes |
| SGA | yes | yes | yes | yes | |
| Tablespace size | yes | yes | yes | yes | |
| Installed DB components | yes | yes | yes | yes | |
| Upgrade, Downgrade info | yes | yes | yes | yes | |
| PSU, patches | yes | yes | yes | yes | |
| Interconnect | Traffic MB/sec | yes | |||
| Configuration | yes | ||||
| Datafiles | Performance stats (table) | yes | yes | yes | |
| Global Cache | get time | yes | |||
| block a sec | yes | ||||
| block 2 way/3 way | yes | ||||
| block bussy/congest, grant congest | yes | ||||
| block lost, blocks corrupted/lost, retry | yes | ||||
| split, bussy release, disk read, multiblock request, grant busy, busy acquire | yes | ||||
| remaster | yes | ||||
| CPU | Host CPU usage | yes | yes | yes | |
| CPU core Per Sec | yes | yes | yes | ||
| CPU core Per Txn | yes | yes | yes | ||
| IO | Total | yes | yes | yes | yes |
| Physical Read | yes | yes | yes | yes | |
| Physical Write | yes | yes | yes | yes | |
| Data | Total | yes | yes | yes | yes |
| Redo | yes | yes | yes | yes | |
| Physical Read | yes | yes | yes | yes | |
| Physical Write | yes | yes | yes | yes | |
| SGA data | Block Changes | yes | yes | yes | |
| Logical Read | yes | yes | yes | ||
| Session | Session | yes | yes | yes | |
| Current logons count | yes | yes | yes | ||
| Active serial | yes | yes | |||
| Logons per sec | yes | yes | |||
| Active paralel | yes | yes | |||
| Avg active | yes | yes | |||
| Blocking | yes | yes | |||
| Long Running | yes | yes | |||
| Longest Block | yes | yes | |||
| Network | MB/sec | yes | yes | yes | yes |
| Ratio | Buffer Cache Hit | yes | yes | yes | yes |
| PGA Cache Hit | yes | yes | yes | yes | |
| Memory Sorts | yes | yes | yes | yes | |
| Soft Parse | yes | yes | yes | yes | |
| CPU Time | yes | yes | yes | yes | |
| Wait Time | yes | yes | yes | yes | |
| Latency | DB files read | yes | yes | yes | yes |
| DB files write | yes | yes | yes | yes | |
| LOG files write | yes | yes | yes | yes | |
| Flashback latency | yes | yes | yes | yes | |
| Wait class | Average wait FG | yes | yes | yes | yes |
| Average wait | yes | yes | yes | yes | |
| Wait Time | yes | yes | yes | yes | |
| Wait Time (foreground) | yes | yes | yes | yes | |
| Wait | yes | yes | yes | yes | |
| Services | Physical Writes | yes | yes | yes | yes |
| Physical Reads | yes | yes | yes | yes | |
| Sessions | yes | yes | yes | yes | |
| Active / Blocked | yes | yes | yes | yes | |
| User Call | yes | yes | yes | yes | |
| Transaction | yes | yes | yes | yes | |
| Execustion | yes | yes | yes | yes | |
| Cursor | yes | yes | yes | yes | |
| Logical Read | yes | yes | yes | yes | |
| Physical IO | yes | yes | yes | yes | |
| Redo | yes | yes | yes | yes | |
| DB Time | yes | yes | yes | yes | |
| AAS by Wait Time | yes | yes | yes | yes | |
| ASM Disk group | Configuration | yes | yes | yes | yes |
| Used in % | yes | yes | yes | yes | |
| Used in GiB | yes | yes | yes | yes | |
| Free in GiB | yes | yes | yes | yes | |
| Usable after a disk failure | yes | yes | yes | yes | |
| Offline disks | yes | yes | yes | yes | |
| ASM Disk | Configuration | yes | yes | yes | yes |
| Used in % | yes | yes | yes | yes | |
| Used in GiB | yes | yes | yes | yes | |
| Free in GiB | yes | yes | yes | yes | |
| Total IOPS | yes | yes | yes | yes | |
| Read IOPS | yes | yes | yes | yes | |
| Write IOPS | yes | yes | yes | yes | |
| Data in MB/sec | yes | yes | yes | yes | |
| Latency in mili sec | yes | yes | yes | yes | |
| Hot/Cold IOPS | yes | yes | yes | yes | |
| Hot/Cold MB/sec | yes | yes | yes | yes | |
| IO Errors | yes | yes | yes | yes | |
| Data Guard | Configuration | yes | yes | yes | yes |
| Destination | yes | yes | yes | yes | |
| Apply Lag | yes | yes | yes | yes | |
| Gap | yes | yes | yes | yes | |
| SQL Query | User Transaction | yes | yes | yes | yes |
| User Commit | yes | yes | yes | yes | |
| Open Cursor | yes | yes | yes | yes | |
| Current Open Cursor | yes | yes | yes | yes | |
| Hard Parse | yes | yes | yes | yes | |
| Execution | yes | yes | yes | yes | |
Last updated: