Linux Pressure
Common Causes & What the Output Means
- Some line: Time when at least some tasks are stalled.
- Full line: Time when all non-idle tasks are stalled (severe).
-
High PSI, Low Usage: Tasks are waiting, often due to:
- Memory Pressure: High kswapd activity moving pages to swap, causing page faults.
- I/O Pressure: Disk/network bottlenecks making processes wait.
- Thrashing: Constant memory page swapping, wasting CPU cycles
What is CPU Pressure?
- CPU Usage: Shows how much CPU is busy (running tasks).
- CPU Pressure: Shows how much CPU is idle because tasks are waiting for it (or other resources like memory/I/O)
How to Check CPU Pressure (PSI)
-
Kernel Files: Check /proc/pressure/cpu for percentages of time tasks waited (e.g., avg10 for 10s, avg60 for 60s, avg300 for 300s).
cat /proc/pressure/cpu
Support in XorMon
- Proxmox hosts by default
- Linux: it needs to be enabled at first
grubby --update-kernel=ALL --args="psi=1"
# or
echo 1 > /sys/kernel/psi_enabled

# test if this exists
ls -l /proc/pressure/cpu
Examples
Proxmox 9 pressure metrics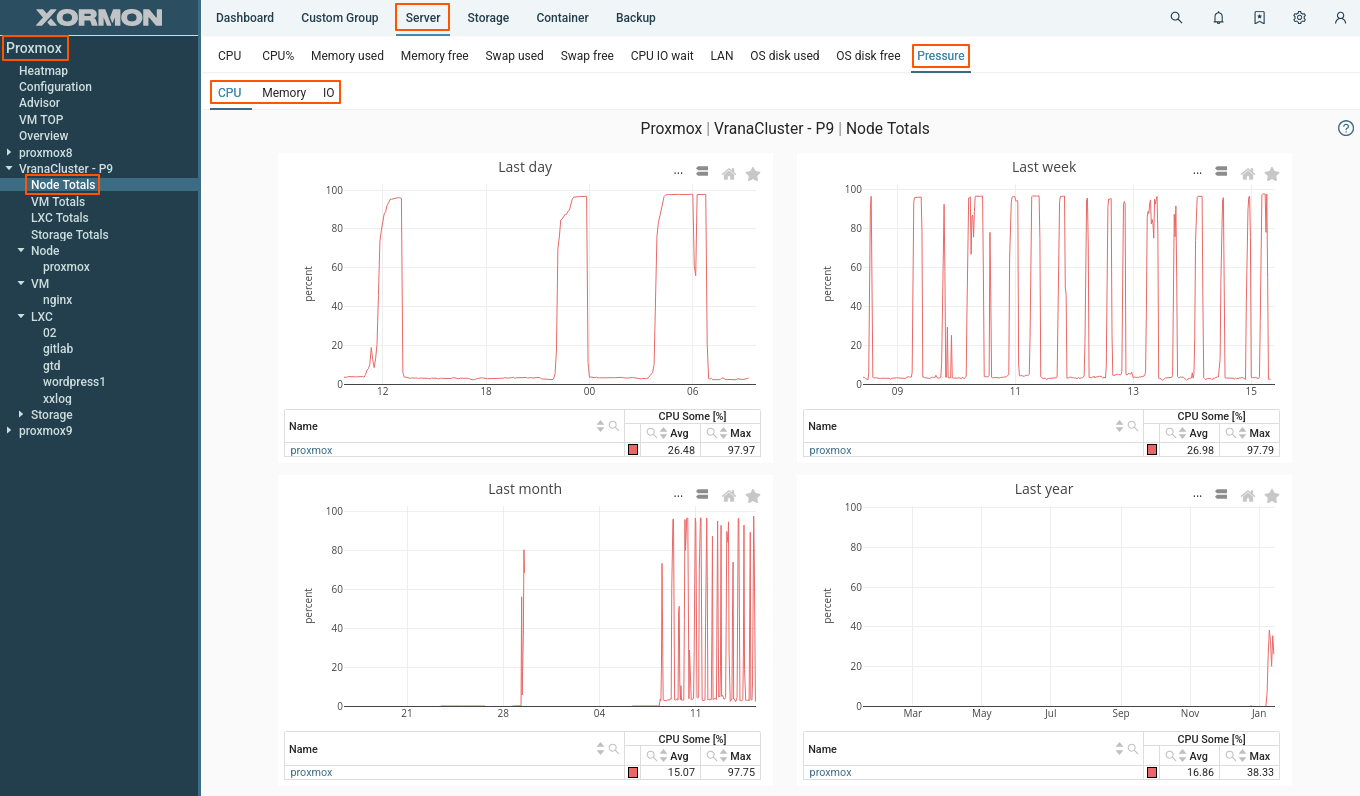 |