Alerting
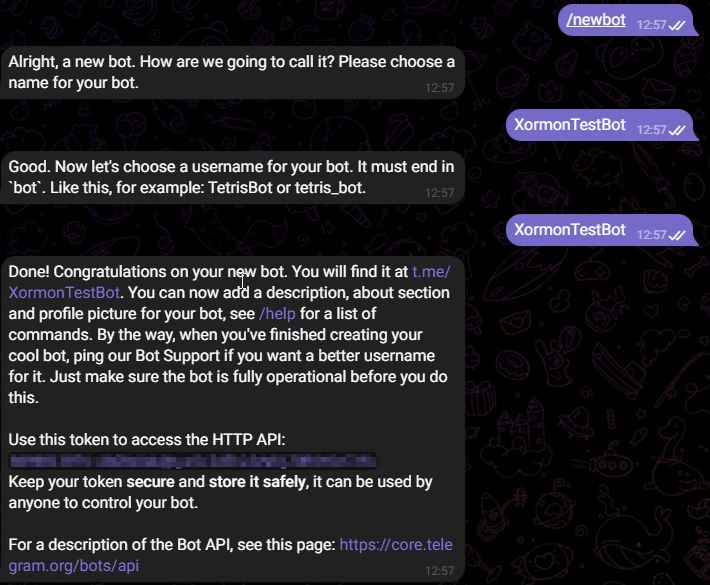
- Create a new bot following this core.telegram.org/bots/features#botfather
After creation you receive API token e.g. "110201543:AAHdqTcvCH1vGWJxfSeofSAs0K5PALDsaw"
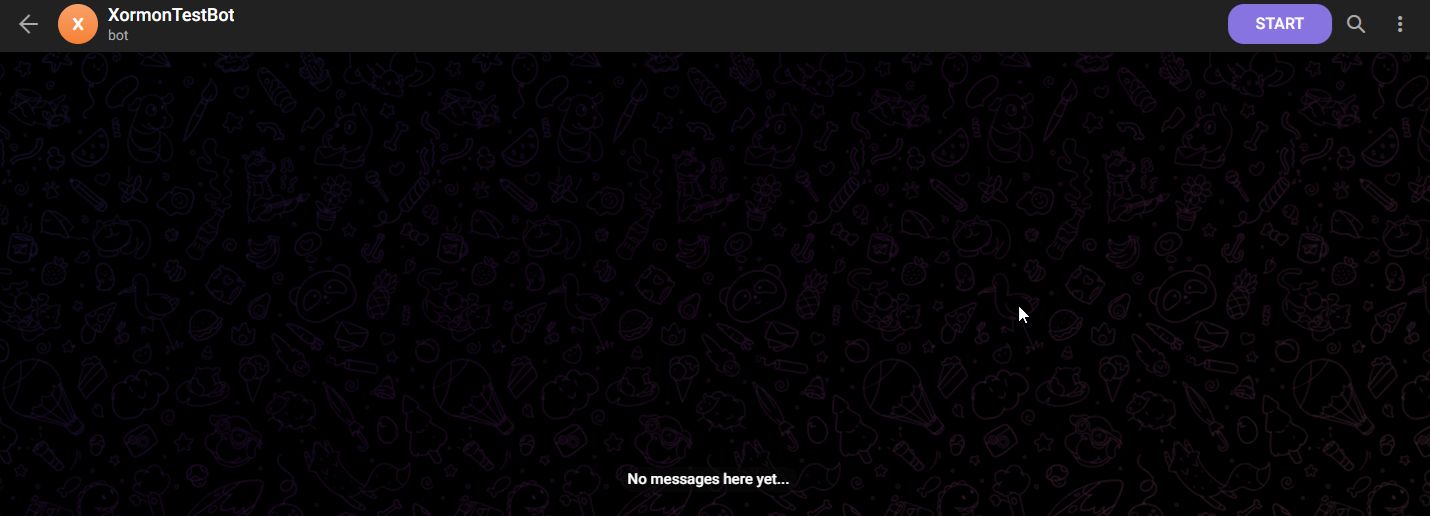
- Open chat with your newly created bot and click "START" button, you can send /start alternatively and also send him some test message
- Open new window with URL https://api.telegram.org/bot<TOKEN>/getUpdates where you replace <TOKEN> from the step 1
- In the result JSON you should find chat.id, like example "123456789"
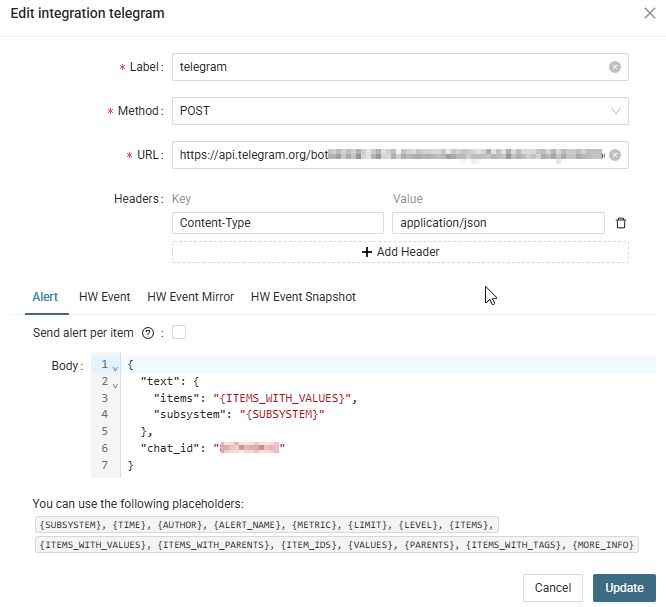
"chat":{ "id":123456789, "first_name":"First", "last_name":"Second", "type":"private" }, - Create new Custom integration in Xormon, using the <TOKEN> and <CHAT_ID>:
URL: https://api.telegram.org/bot<TOKEN>/sendMessage
Headers: Content-Type: application/json
Custom JSON body with "chat_id" and "text" keys required, "chat_id" is a value from step 4:
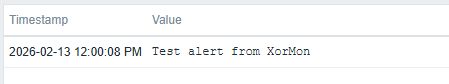
- If alert is triggered you get message:

XorMon uses zabbix_sender to send alerts to Zabbix.
- Install Zabbix agent in any way like:
RedHat:
dnf install https://repo.zabbix.com/zabbix/6.4/rhel/8/x86_64/zabbix-release-6.4-1.el8.noarch.rpm
sudo dnf clean all
sudo dnf install zabbix-sender
Debian:wget https://repo.zabbix.com/zabbix/7.0/debian/pool/main/z/zabbix-release/zabbix-release_latest_7.0+debian12_all.deb dpkg -i zabbix-release_latest_7.0+debian12_all.deb apt update apt install zabbix-sender
- Install zabbix_sender as per you OS platform:
www.zabbix.com/documentation/current/en/manual/installation/install_from_packages
repo.zabbix.com/zabbix/
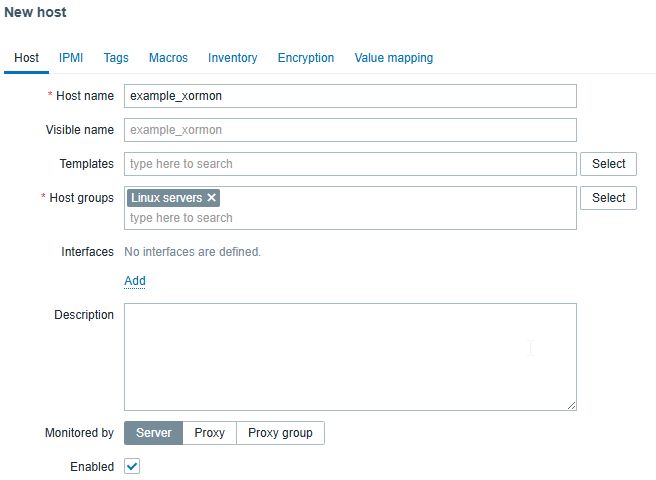
- Create a new host in Zabbix or use existing one
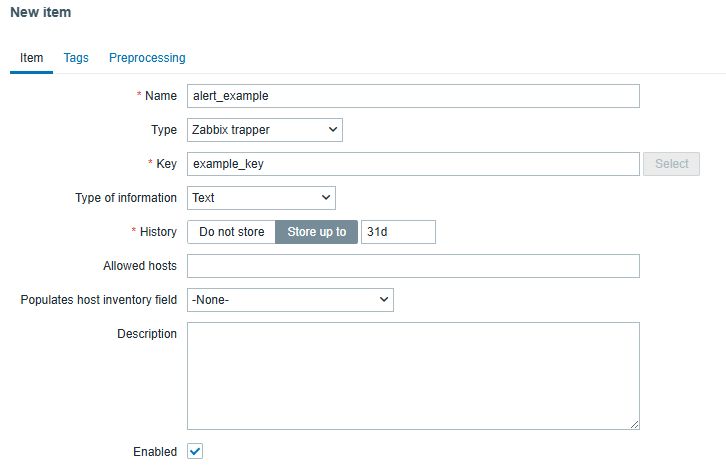
- Create new item for that host with:
Type: Zabbix trapper
Type of information: Text
- In the XoxMon fill in the Zabbix Server, Port, Host and Key as you have entered in Zabbix
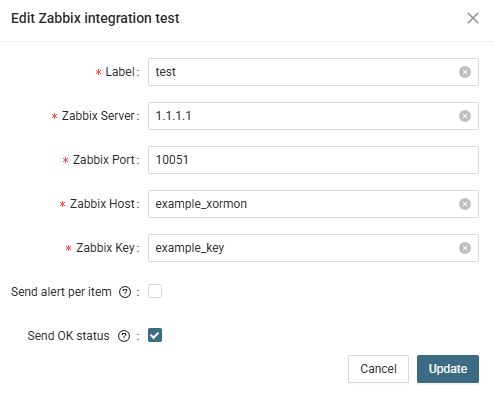
- Press the Test button to check test message in Zabbix
Follow this to read about Anomaly alerting.
Follow this to read about Ping alerting.
You can create alerts based on performance data metrics for all configured devices.
Any metric that is collected by the tool can be selected for alerting.
Configure it via the UI ➡ Settings ➡ Alerting ➡ Configuration
Define email groups under "Email" tab at first.
Put a name, select a class, subsystem (volume) and volumes here via regex ('.*' means all volumes on all storage devices) ➡ Add
Select a metric (Latency)
Put threshold and email targed groups defined in advance ➡ Save
Then via a "+" sign in the alert line on the right you can add more metrics to be alerted for the same alert group.
Storage email alert
Server email alert
Any metric that is collected by the tool can be selected for alerting.
Configure it via the UI ➡ Settings ➡ Alerting ➡ Configuration
Define email groups under "Email" tab at first.
How to create a new alert
Storage-based alert: select "Storage" ➡ New Alert Group |
Put a name, select a class, subsystem (volume) and volumes here via regex ('.*' means all volumes on all storage devices) ➡ Add
 |
Select a metric (Latency)
 |
Put threshold and email targed groups defined in advance ➡ Save
 |
Then via a "+" sign in the alert line on the right you can add more metrics to be alerted for the same alert group.
Video
- Alerting
- Filter items by parent device
Examples
Email alerts have included graphs by default, you can set your own time range of that graph in the Alerting Options tabStorage email alert
 |
 |
Server email alert
 |
 |
It raises an alert when any critical HW or SW error is detected for any devices.
Basically, the alert is sent when any device goes to the "red" status in the global health status dashboard.
Once a device goes back to "green", clear alert is sent.
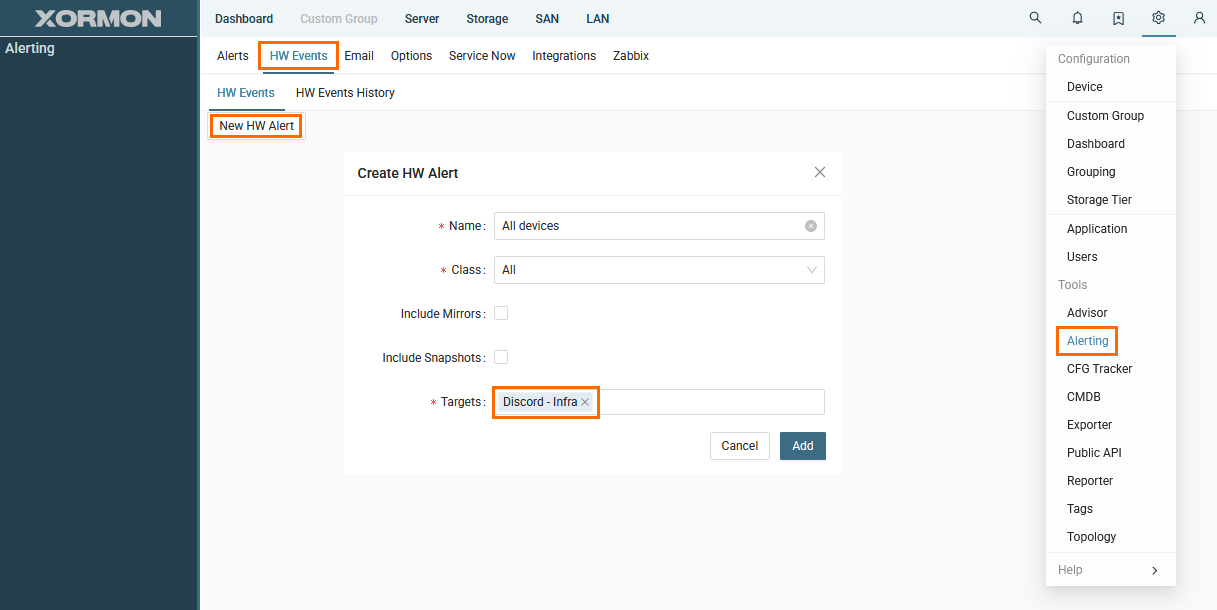
You can configure via the UI ➡ Settings ➡ Alerting ➡ Options HW Event
Define email groups under "Email" tab at first.
Basically, the alert is sent when any device goes to the "red" status in the global health status dashboard.
Once a device goes back to "green", clear alert is sent.
You can configure via the UI ➡ Settings ➡ Alerting ➡ Options HW Event
Define email groups under "Email" tab at first.
 |
So far available:
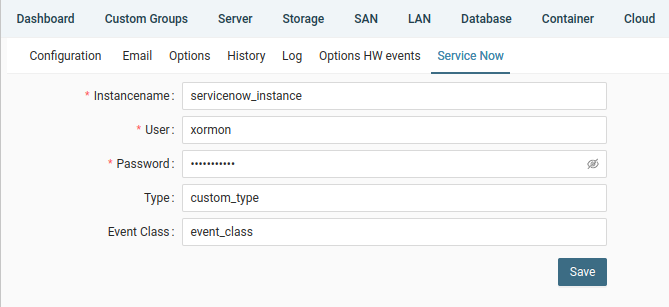
- SNMP Trap
- ServiceNow
- Zabbix
- Discord
- Telegram
- AlarmsOne
- Riverbed NetIM
- HPE OpenView
- Jira
- Nagios
- others can be done as needed
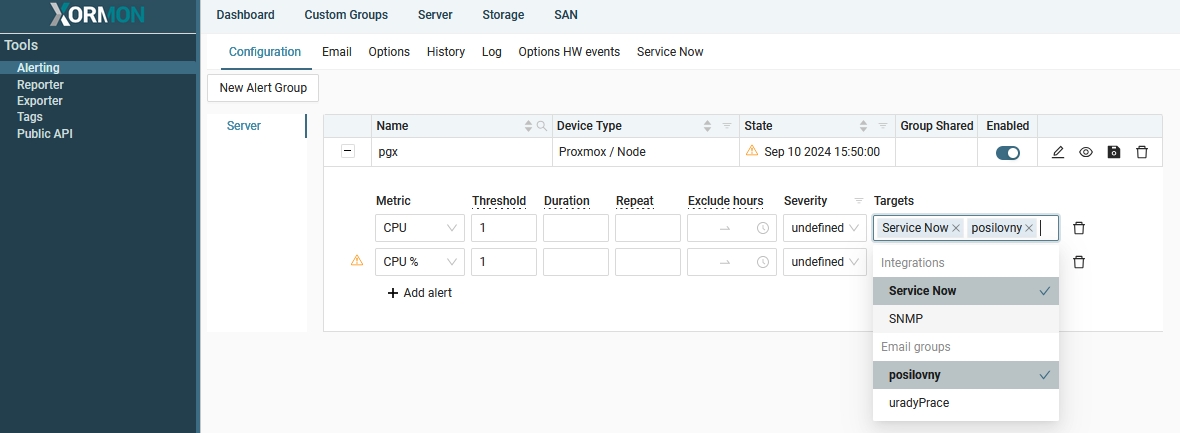
Select prefered integration for each alert
 |
 |
The Integration builder allows you to send HW events and alerts from Xormon to any other tool that supports REST API or Webhooks.
With Integration builder you can compose the request:
For example
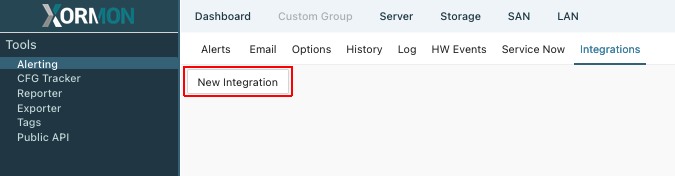
Xormon UI → Settings → Alerting → tab: Integrations
Performance alert request body examples:
Add newly created integration to Alert or HW event configuration
With Integration builder you can compose the request:
- endpoint URL
- method (GET, POST, PUT, PATCH, DELETE)
- request headers
- request body in JSON format
For example
- {DEVICE} - device name
- {STATUS} - reported status
- {METRIC} - name of the metric being alerted
- {VALUES} - values that triggered the alert
- {ITEMS} - list of items crossing the threshold valaue
- And more
Xormon UI → Settings → Alerting → tab: Integrations
 |
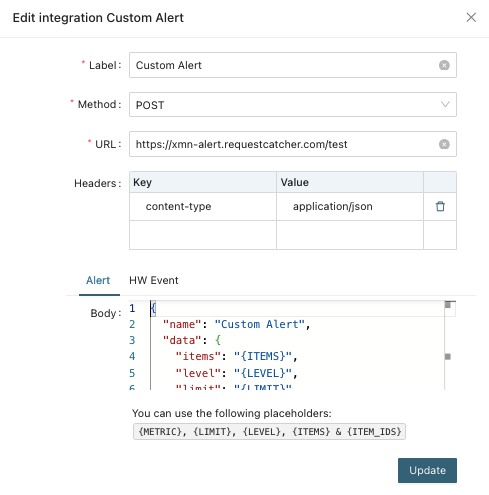 |
Performance alert request body examples:
{
  "name": "Custom Alert",
  "data": {
    "items": "{ITEMS}",
    "level": "{LEVEL}",
    "limit": "{LIMIT}",
    "metric": "{METRIC}",
    "values": "{VALUES}"
  }
}
Add newly created integration to Alert or HW event configuration
 |
 |
How to use Integration builder to send alerts from XorMon to Discord using webhook.
- Create new webhook in Discord
Go to server settings -> Integrations -> Webhooks
Enter the name and channel where you want to receive messages.
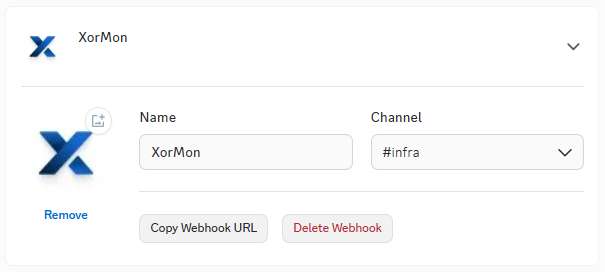
- Copy webhook URL
- Create new Integration in XorMon
- Go to Settings -> Alerting -> Integrations
- Click "New Integration"
- Select POST method
- Paste Discord webhook URL
- Add header "Content-Type: application/json"
- Add JSON message
- The message has to contain:
-
- "username" - the name used when creating the webhook
- "content" - the content of the message that will be sent to the Discord channel
Message example for HW Event:
{
  "content": "HW Event: {DEVICE} ({CLASS}/{HW_TYPE}) changed to {STATUS} ({REASON})",
  "username": "XorMon"
}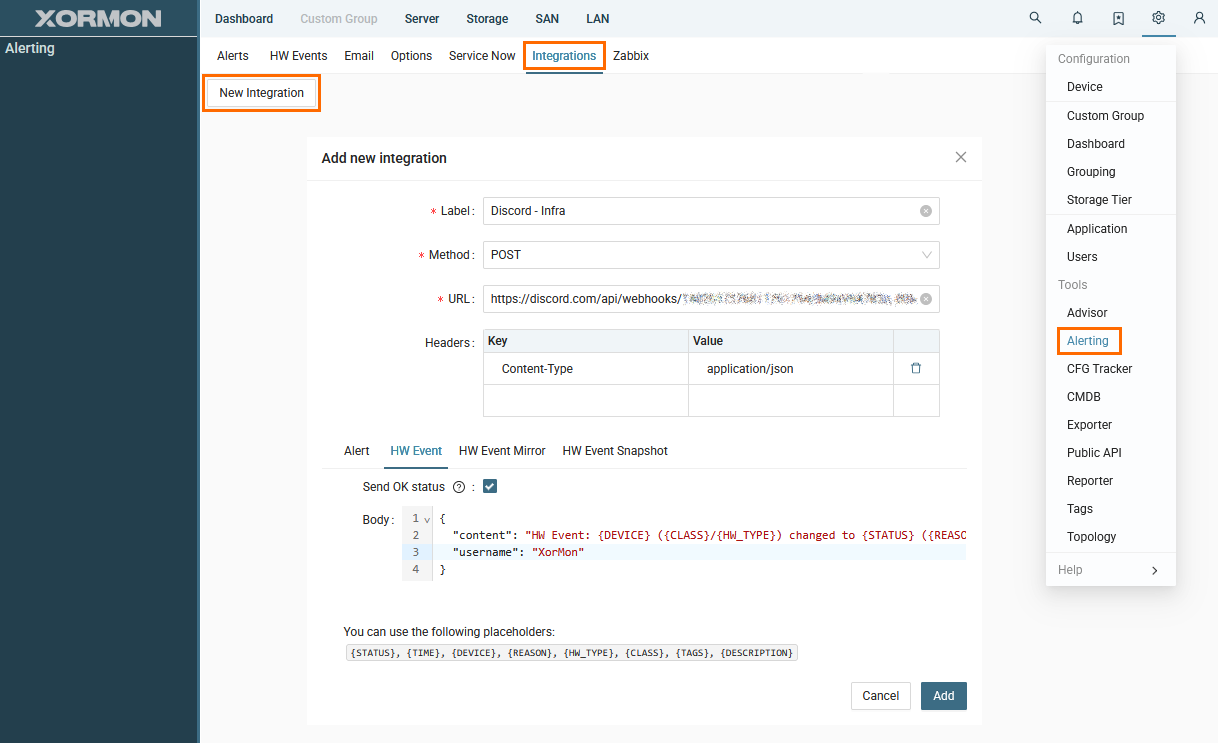
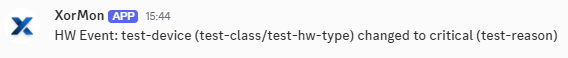
- Test the integration
You should get test message in the Doscord channel
- Use the new integration in a HW Event configuration