Monitoring: AIX, IBM i, VIOS, Linux on Power
Tool gets data via HMC REST API.
Monitoring Resources
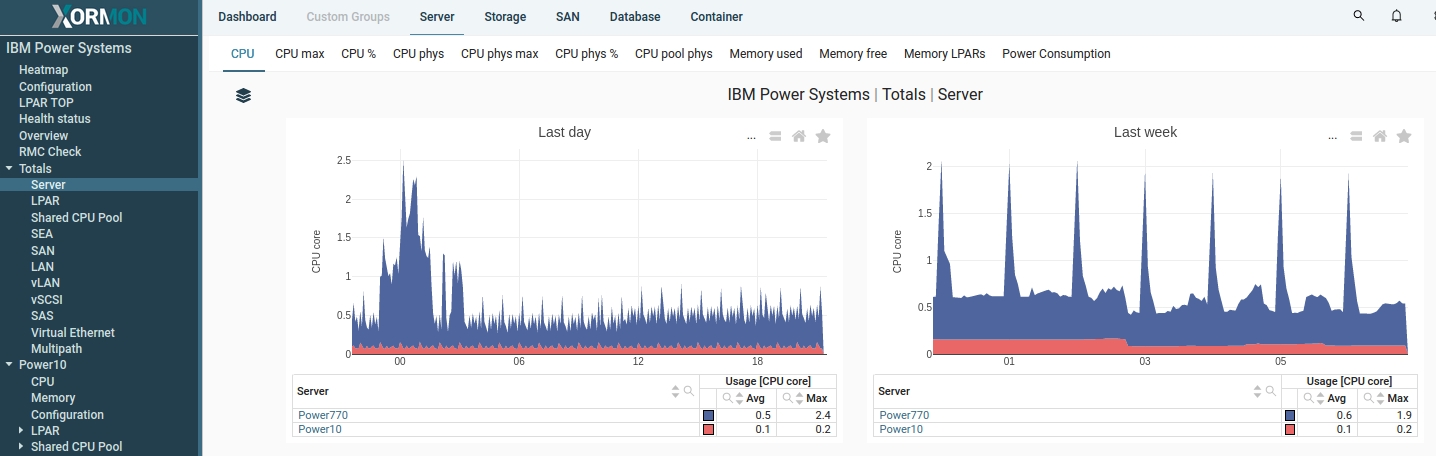
- CPU total
- CPU pool
- Shared Processor Pools
- LPAR (AIX, VIO, IBMi, Linux on Power)
- Physical and Logical interfaces
- Shared Storage Pools
- Enterprise Pools 2.0 (PEP2.0)
- Topology
- Power consumption
Monitoring Metrics
- CPU usage in
- Core
- Physical Core
- %
- Memory allocation
- Eth/FCS/SR-IOV/SAS/IVE adapter performance (MB/sec, IO per sec, Latency)
Other Monitoring Features
- CPU Workload Estimator
- Resource Configuration Advisor
- Historical Reporting
- Custom Groups
- Heatmap
- Trends
- Configuration
Additional detailed OS data can be obtained from AIX / VIO/ Linux on Power OS agents running in LPARs.
| OS CPU | CPU sys, user, IO wait |
| CPU queue | Load avrg, Blocked processes |
| JOB | CPU, Memory |
| Memory utilization | Used, FS cache, Pinned |
| LAN (ethernet adapters) | MB/sec, packet count, errors |
| SAN (FC,vSCSI adapters) | MB/sec, IO/sec, Latency, errors |
| Paging space utilization | Usage in % |
| Paging rate | MB/sec |
| Filesystem usage | Usage in %, GB |
| Error log | errpt |
| LVM | filesystem, VG, LV, disk, storage, volume |
| Disk multipath | disk |
| Shared Ethernet Adapted (SEA) | MB/sec, packet count |