Synology monitoring
Synology monitoring in XorMon, open source under GPL v3, obtains data from Synology NAS storage via the SNMP protocol. XorMon graphs IO, data and block size per volume, IO, data and latency per LUN, plus drive, port and CPU statistics, with health status and alerting.
Which Synology metrics does XorMon monitor?
Per volume, XorMon graphs IO, data and block size; per LUN, IO, data and latency; per drive, IO and data; per port, data.
The Synology tab of the feature matrix also lists CPU, health status, and performance and hardware event alerting. XorMon has no data for individual pools: the POOL row of the matrix gives the total of the array, the "array_total" pool, which is the sum of all volumes.
Sources: Feature matrix, Synology tab, and installation steps below, updated 2026-11-11.
How does XorMon collect Synology data over SNMP?
XorMon obtains data from Synology via the SNMP protocol, on UDP port 161.
The XorMon deployment table lists Synology with SNMP v2c and v3 as the protocol and UDP 161 as the port.
Sources: installation steps below, updated 2026-11-11, and XorMon deployment.
Does XorMon cover Synology network monitoring?
XorMon graphs the data throughput of each network port of the Synology NAS; the Synology tab of the feature matrix lists no other port metric.
Change Tracker records the IP address and version of the Synology device. Event alerting sends an alert when a device turns red in the global health status dashboard, and a clear alert when it turns green again.
Sources: Feature matrix, Synology tab, Change Tracker, updated 2026-10-19, and Alerting, updated 2026-10-13.
Key points
- Monitors Synology NAS storage via the SNMP protocol.
- Volume: IO, data and block size; LUN: IO, data and latency.
- Drive, port and CPU statistics, plus health status, and performance and hardware event alerts.
- No data for individual pools: the POOL row of the matrix is the array total ("array_total").
- Open source license (GPL v3).
Installation and configuration for Synology
Data is obtained from Synology via SNMP protocol.Note: DSM version 6.1 and older do not support capacity data.
We do not collect data for pools. The reason is:
There are two types of pools:
- "Better performance" = Single volume support
- "Higher flexibility" = Multiple volumes support
We only have the "array_total" pool (sum all volumes).
Install Prerequisites
Skip that in case of Virtual Appliance.- Linux RedHat / Rocky
Note you might need to allow optional repositories on RHEL to yum can find it# umask 0022 # yum install net-snmp # yum install net-snmp-utils # yum install net-snmp-perl
Use rhel-7-for-power-le-optional-rpms for Linux on Power etc ...# subscription-manager repos --list ... # subscription-manager repos --enable rhel-7-server-optional-rpms
- Linux Debian/Ubuntu
Assure that this line is commented out in /etc/snmp/snmp.conf% umask 0022 % apt-get install snmp libsnmp-perl snmp-mibs-downloader
#mibs :
If apt-get does not find snmp-mibs-downloader package then enable contrib and non-free repositories.
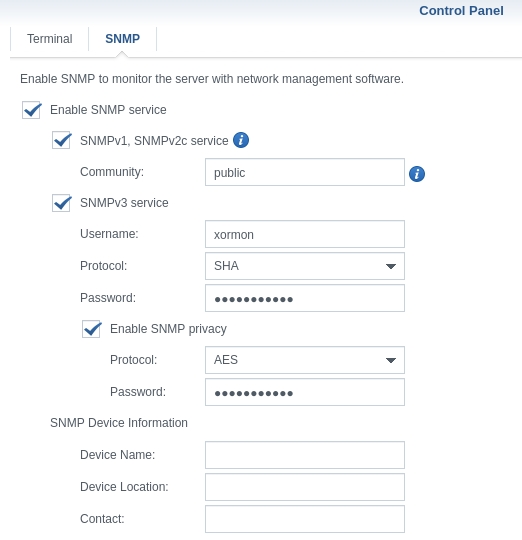
Storage SNMP configuration
-
Open storage UI ➡Terminal & SNMP:
 |
XorMon storage configuration
-
Add storage into configuration from the UI:
XorMon UI ➡ Settings icon ➡ Device ➡ Storage ➡ New ➡ Vendor:device ➡ Synology
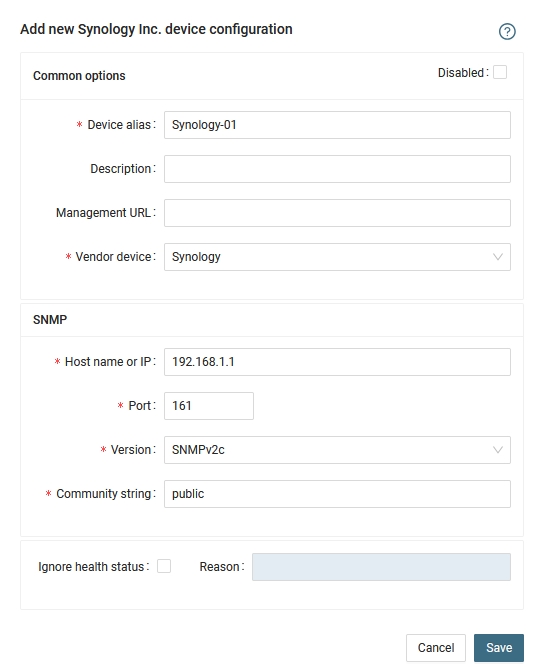
- Run "Test" for configured storage device, it must show "OK"
-
Wait about 1 hour, then reload the web browser, you should see it in XorMon UI
Running arrays from several vendors? XorMon can monitor your storage systems in one place.
Last updated: