Red Hat Ceph Monitoring
Ceph storage monitoring in XorMon covers Red Hat Ceph Storage. XorMon, open source under GPL v3, collects its data from the Prometheus export module of the Ceph manager, and graphs capacity, IO, data and placement groups per pool, IO, data and latency per volume and OSD, plus RGW, MDS and BlueStore metrics, health status and alerting.
Does XorMon monitor Red Hat Ceph Storage?
Yes: XorMon monitors Red Hat Ceph Storage, listed among the supported storage systems on the storage monitoring page.
XorMon collects Red Hat Ceph Storage data from the Prometheus export module. Ceph has its own monitoring page, which describes the same Prometheus export module.
Sources: Storage monitoring, updated 2026-11-07, installation steps below, updated 2026-11-11, and Ceph monitoring, updated 2026-11-07.
Which Ceph storage metrics does XorMon monitor?
Per pool, XorMon graphs capacity, IO, data and placement groups; per volume, IO, data and latency; per OSD, IO, data, latency and capacity.
The Ceph tab of the feature matrix also lists cache, get, put and request for RGW, request, latency, directory and inode for MDS, and BlueStore and RocksDB for the backend. It adds health status, and performance and hardware event alerting.
Sources: Feature matrix, Ceph tab.
How does XorMon connect to the Red Hat Ceph Storage nodes?
XorMon connects to the Prometheus export module, which by default accepts HTTP requests on port 9283.
XorMon is pointed at all Ceph manager nodes which can host the Prometheus module, or only at a load balanced hostname that translates to the active manager node. The XorMon deployment table lists Ceph with Prometheus API access on port 9283.
Sources: installation steps below, updated 2026-11-11, and XorMon deployment.
Key points
- Monitors Red Hat Ceph Storage through the Prometheus export module of the Ceph manager.
- Pool: capacity, IO, data and placement groups.
- Volume and OSD statistics, plus RGW, MDS, BlueStore and RocksDB metrics.
- Health status, performance and hardware event alerts, open source license (GPL v3).
Installation and configuration for Red Hat Ceph Storage
XorMon collects Red Hat Ceph Storage data from Prometheus export module.Ceph version 14.2 (Nautilus) and newer are supported.
Enable Prometheus export module
ceph mgr module enable prometheusEnable Pool metrics
Selected pools
ceph config set mgr mgr/prometheus/rbd_stats_pools "pool1,pool2,poolN"All pools
ceph config set mgr mgr/prometheus/rbd_stats_pools "*"Enable performance counters in Prometheus
With the introduction of ceph-exporter daemon, the Prometheus module will no longer export Ceph daemon perf counters as prometheus metrics by default.
However, one may re-enable exporting these metrics by setting the module option exclude_perf_counters to false:
ceph config set mgr mgr/prometheus/exclude_perf_counters falseConfigure firewall
Enable access to Prometheus export module from XorMon.
By default module accepts HTTP requests on port 9283.
XorMon storage configuration
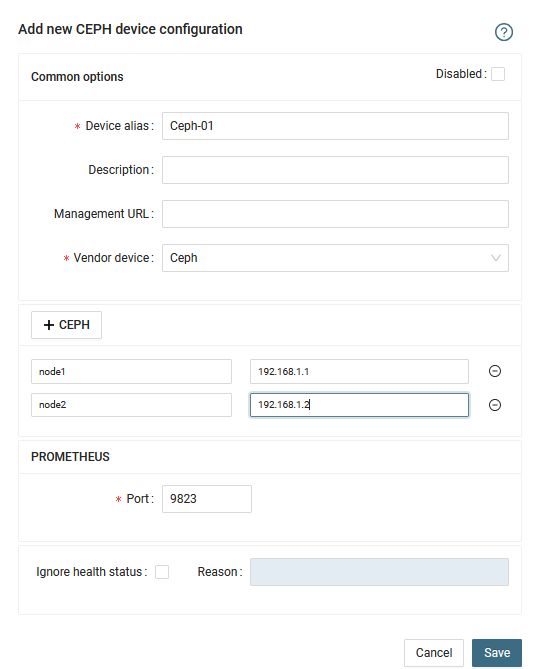
- Configure hostnames/IPs
If you are using a load balancer translating hostname to an active manager node, then you can fill in only the load balanced hostname.
Otherwise, fill in IP addresses/hostnames of all CEPH manager nodes which can host the Prometheus module.
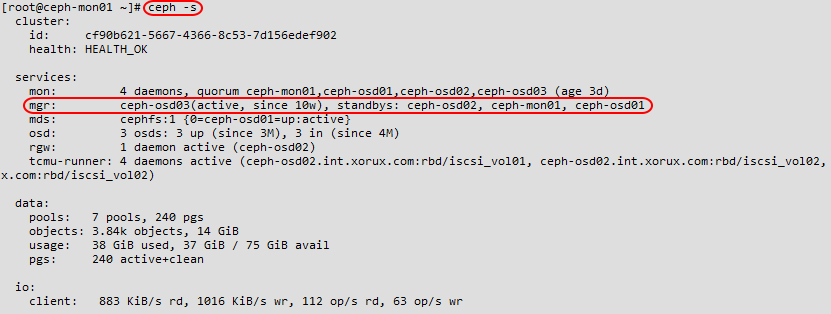
You cen get a list of manager nodes from "ceph -s" command.
-
Add storage into configuration from the UI:
XorMon UI ➡ Settings icon ➡ Device ➡ Storage ➡ New ➡ Vendor:device ➡ Ceph
- Run "Test" for configured storage device, it must show "OK"
-
Wait about 1 hour, then reload the web browser, you should see it in XorMon UI
Other storage systems are covered as well: see storage monitoring in XorMon.
Last updated: