Rubrik monitoring
Rubrik monitoring in XorMon covers Rubrik CDM, read through the REST API from the XorMon host to one of Rubrik's nodes. XorMon graphs capacity, IO, data, latency, block size, Archive and Ingest per pool, IO, data, cache and network per node, and shows the health status.
Which Rubrik CDM metrics does XorMon show in its UI?
XorMon shows Rubrik CDM pools with capacity, IO, data, latency, block size, Archive and Ingest, and Rubrik nodes with IO, data, cache and network.
The Rubrik tab of the feature matrix also marks health status, performance alerting and hardware event alerting for CDM. Event alerting sends an alert when a device turns red in the global health status dashboard.
Sources: Feature matrix, Rubrik tab, and Alerting, updated 2026-10-13.
How does XorMon connect to Rubrik CDM nodes?
XorMon gets data from Rubrik CDM using REST API, with access from the XorMon host to one of Rubrik's nodes on port 443.
The XorMon deployment table lists Rubrik CDM with REST API as the protocol and port 443.
Sources: installation steps below, updated 2026-11-09, and XorMon deployment.
Is Rubrik monitored as storage or as backup in XorMon?
Both: XorMon lists Rubrik among the storage systems on the storage monitoring page and among the backup software on the backup monitoring page, and its installation sits under the storage section.
The feature matrix has a Rubrik tab in its storage section and in its backup section, with the same CDM metrics. Change Tracker records the device IP address and the pool total capacity of Rubrik CDM.
Sources: Storage monitoring and Backup monitoring, both updated 2026-11-07, Feature matrix, and Change Tracker, updated 2026-10-19.
Key points
- Monitors Rubrik CDM through the REST API, from the XorMon host to one of Rubrik's nodes.
- Pools: capacity, IO, data, latency, block size, Archive and Ingest; nodes: IO, data, cache and network.
- Listed under both storage and backup monitoring; Change Tracker records the device IP address and pool total capacity.
- Health status, performance and hardware event alerts, open source license (GPL v3).
Installation and configuration for Rubrik CDM
It gets data from Rubrik CDM using REST API.Note: From the CDM version 9.2 API user/pass logins no longer return token by default so it is necessary to switch to token authorization which can be set to 1 year expiration.
Storage connectivity
- Allow access from the XorMon host to one of Rubrik’s nodes on port 443
- Create a new user for XorMon with the ReadOnlyAdminRole role
- Login to Rubrik CDM UI
- Go to Settings ➡ Access management section ➡ Users
- Add Local User and assign “ReadOnlyAdminRole”
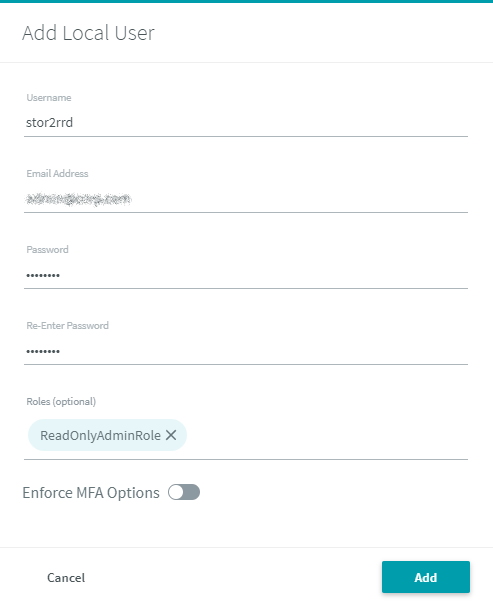
(example uses 'stor2rrd' user but use 'xormon' preferably)
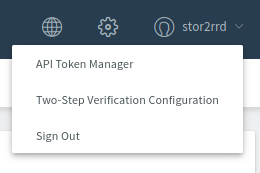
- As an option you can use token based authorization: Rubrik UI ➡ Username ➡ API Token manager
- Login to Rubrik CDM UI
- Add storage into configuration from the UI:
Settings icon ➡ Device ➡ Storage ➡ New ➡ Vendor:device ➡ Rubrik : Rubrik CDM
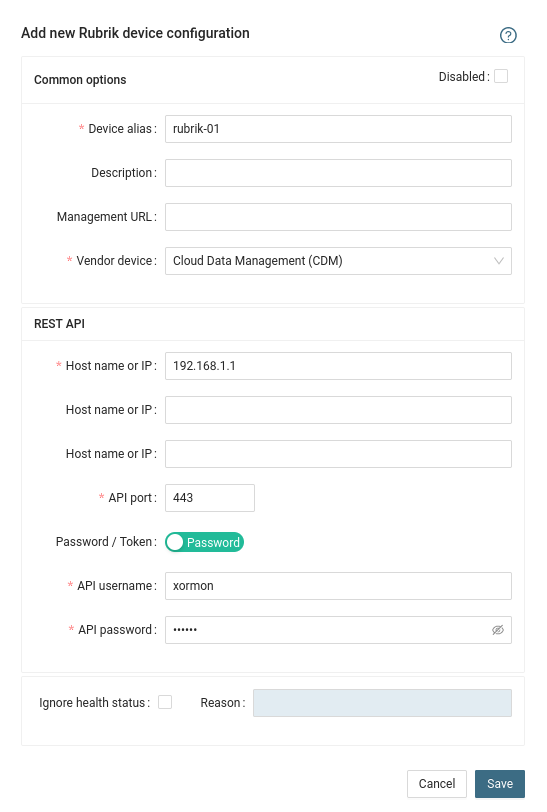
- Run "Test" for configured storage device, it must show "OK"
-
Wait about 1 hour, then reload the web browser, you should see it in XorMon UI
XorMon storage configuration
For capacity and performance of other storage systems, see storage capacity and performance monitoring.
Dernière mise à jour :