ExaGrid monitoring
XorMon, open source under GPL v3, monitors ExaGrid Tiered Backup Storage through SNMP, the only way to get capacity and performance data from an ExaGrid device, enabled on all servers of the monitored site. It graphs capacity, CPU, memory and data per server, plus data, packets and errors per port, with health status and alerts.
What does XorMon monitor on ExaGrid Tiered Backup Storage?
XorMon monitors ExaGrid Tiered Backup Storage, listed among the supported storage systems, at two levels: each server of the ExaGrid site and its ports.
The ExaGrid tab of the feature matrix covers the Server / Node and Port subsystems, plus health status and alerting. Change Tracker has an ExaGrid Backup tab that records the IP address of the device.
Sources: Storage monitoring, updated 2026-11-07, Feature matrix, ExaGrid tab, and Change Tracker, updated 2026-10-19.
Which ExaGrid backup appliance metrics does XorMon collect?
Per ExaGrid server, XorMon graphs capacity, CPU, memory and data; per port, it graphs data, packets and errors.
The feature matrix also marks health status, performance alerting and hardware event alerting for Tiered Backup Storage. Event alerting sends an alert when a device turns red in the global health status dashboard, and a clear alert when it turns green again.
Sources: Feature matrix, ExaGrid tab, Alerting, updated 2026-10-13, and Health status, updated 2026-05-04.
How does XorMon connect to ExaGrid systems?
SNMP interface is the only way to get capacity and performance data from an ExaGrid device to XorMon, and it must be enabled for all servers in the monitored site.
The XorMon deployment table lists ExaGrid Tiered Backup Storage with read-only access and SNMP as the protocol. In XorMon, an ExaGrid site groups all site servers, each defined by IP address or hostname and its SNMP community string.
Sources: installation steps below, updated 2026-11-09, and XorMon deployment.
Key points
- Monitors ExaGrid Tiered Backup Storage through SNMP, enabled on all servers of the monitored site.
- SNMP is the only way to get ExaGrid capacity and performance data into XorMon.
- Per server: capacity, CPU, memory and data; per port: data, packets and errors.
- Health status, performance and hardware event alerts.
- Read-only SNMP access, open source license (GPL v3).
Installation and configuration for ExaGrid Tiered Backup Storage
SNMP interface is the only way to get capacity and performance data from ExaGrid device to XorMon, it must be enabled for all servers in monitored site to get it work.To enable SNMP on an ExaGrid Appliance
- From the left-hand navigation tree, select an ExaGrid Appliance
- From the top, main menu click Server and all menu options for the server are displayed.
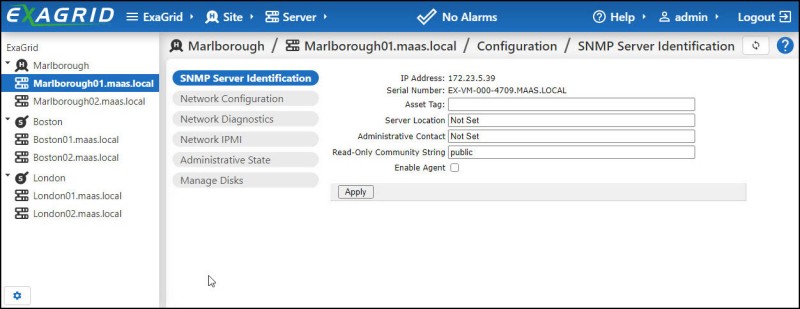
- Under Configuration , select SNMP Identity Configuration and the ExaGrid SNMP Server Identification page is displayed:
- On the SNMP Server Identification page, configure the following SNMP fields:
- Asset Tag - A name or text string that allows you to easily identify the server. This tag appears in several ExaGrid reports.
- Server Location - The MIB system group sysLocation
- Administrative Contact - The MIB system group sysContact
- Read-Only Community String - This is a password that must match your third-party/enterprise management software and must be set in accordance with your corporate security requirements. The default is set to public
- Enable Agent - Must be checked to enable SNMP reporting for the ExaGrid Appliance.
- Click Apply and the SNMP settings are applied to the selected ExaGrid Appliance.
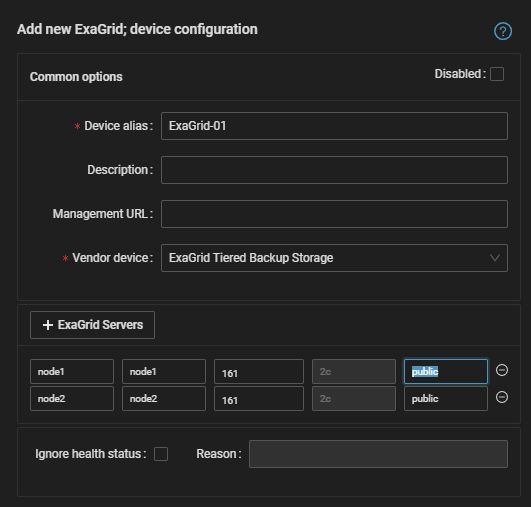
XorMon ExaGrid Site configuration
Create Exagrid site and then add all site servers defined by IP address (or hostname) and corresponding SNMP Community StringAdd storage into configuration from the UI:
XorMon UI: Settings icon ➡ Device ➡ Storage ➡ New ➡ Vendor:device ➡ ExaGrid
 |
For capacity and performance of other storage systems, see storage capacity and performance monitoring.
Dernière mise à jour :