DataCore monitoring
XorMon, open source under GPL v3, monitors DataCore SANsymphony storage through the DataCore REST API package, installed on a proxy Windows machine or on a node of the storage. It graphs capacity, IO, data throughput, latency and block size per pool, plus volume, volume folder, drive, port, node, host and host group statistics.
Which DataCore SANsymphony storage metrics does XorMon monitor?
Per pool, XorMon graphs capacity, IO, data, latency and block size; per volume, IO, data, latency, block size and cache; per drive and per port, IO, data and latency.
The DataCore tab of the feature matrix also lists volume folders and nodes with IO, data and cache, hosts and host groups with IO and data, health status, and performance and hardware event alerting. DataCore SANsymphony is one of the storage systems that provide real per host performance data, so XorMon shows real data for every attached host.
Sources: Feature matrix, DataCore tab, Host data, updated 2026-05-04, and Storage monitoring, updated 2026-11-07.
Which DataCore download does XorMon need for SANsymphony?
XorMon needs the DataCore REST API package, downloaded from the DataCore download page and installed on any Windows Server 2012+ or on a DataCore node.
The product uses the DataCore REST API package to get all necessary data. Two setups are possible: the REST API on a proxy Windows machine, or on a node of the storage.
Sources: installation steps below, updated 2026-11-09.
How does XorMon connect to the DataCore server?
XorMon connects from the XorMon host to the DataCore storage on port 80 (HTTP), the default, or on port 443 when the REST API uses HTTPS.
The storage provides data through HTTP by default, and the DataCore manual describes the change to HTTPS. XorMon reads the data with a Windows user.
Sources: installation steps below, updated 2026-11-09.
Key points
- Monitors DataCore SANsymphony through the DataCore REST API package, on a proxy Windows machine or on a DataCore node.
- HTTP by default, HTTPS supported.
- Pool: capacity, IO, data, latency and block size; volume: IO, data, latency, block size and cache.
- Real per host performance data, plus volume folder, drive, port, node and host group statistics.
- Health status, performance and hardware event alerts, open source license (GPL v3).
Installation and configuration for DataCore SANsymphony
The product uses DataCore REST API package to get all necessary data.Storage connectivity
-
You can use 2 ways of setup. DataCore REST API is installed
- on the proxy Windows machine
- on a node of the storage
-
Download and install DataCore REST API on whatever Windows Server 2012+ or DataCore node.
You can download it from DataCore download page.
Installation requires Windows reboot.
Use REST API 1.07 for DataCore 10.0 PSP7 and newer.
Use REST API 1.06 for olders.
- Storage provide data through HTTP (port 80) by default.
You might change that to HTTPS as per following vendor manual.
-
Allow access from the XorMon host to the DataCore storage on port 80 (http), use 443 in case of HTTPS.
-
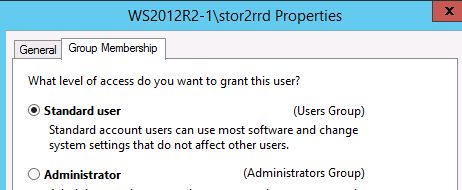
Create user xormon (bellow examples use stor2rrd user) in Windows hosted server on 1 DataCore node
-
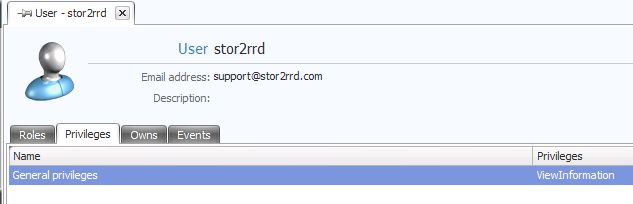
Assign that user on the storage role View
- When you configure all and you see big data gaps in graphs then you have to adjust RequestExpirationTime especially on DataCore SANsymphony 10, PSP 11, Update 1 and newer.
Open "C:\Program Files\DataCore\Rest\Web.config" file and chang the sixth line:
From: <add key="RequestExpirationTime" value="30"/>
To: <add key="RequestExpirationTime" value="1800"/>
You do not have to restart the DataCore node
XorMon storage configuration
-
Add storage into configuration from the UI:
XorMon UI ➡ Settings icon ➡ Device ➡ Storage ➡ New ➡ Vendor:device ➡ DataCore
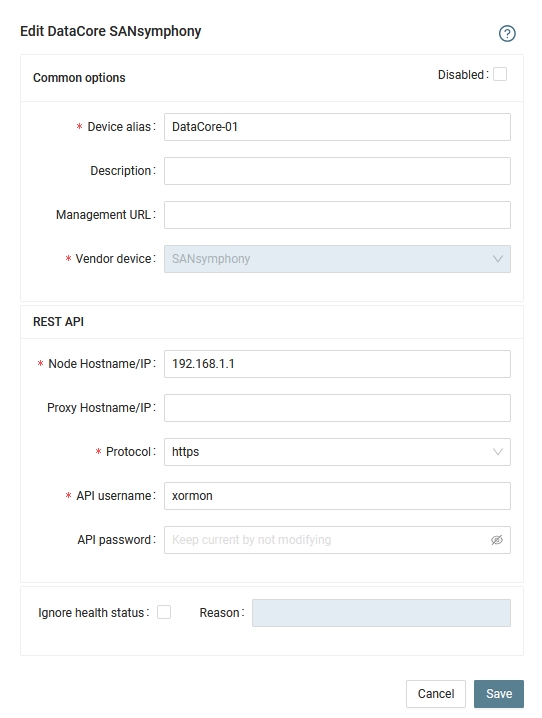
- Run "Test" for configured storage device, it must show "OK"
-
Wait about 1 hour, then reload the web browser, you should see it in XorMon UI
For other vendors, see multi-vendor storage monitoring in XorMon.
Dernière mise à jour :