DDN EXAScaler
XorMon, open source under GPL v3, monitors DDN EXAScaler storage through the REST API, with access from the XorMon host to DDN Insight on port 443 and a read-only user. It graphs IO, data throughput and latency for the SFA subsystem and EXAScaler disks, IO, data and capacity per EXAScaler pool and volume, and node CPU and memory.
Which DDN storage systems does XorMon monitor?
XorMon monitors DDN EXAScaler, the DDN system listed on the storage monitoring page, in the deployment table and in the DDN tab of the feature matrix.
The DDN tab of the feature matrix covers EXAScaler nodes, the SFA subsystem, and EXAScaler pools, volumes and disks. Change Tracker records configuration changes of the DDN device, EXAScaler and SFA, such as hostname and IP address.
Sources: Storage monitoring, updated 2026-11-06, XorMon deployment, Feature matrix, DDN tab, and Change Tracker, updated 2026-10-19.
Which DDN EXAScaler metrics does XorMon collect?
On the SFA subsystem, XorMon graphs IO, data throughput, latency and block size; on EXAScaler pools and volumes, IO, data, capacity and block size; on EXAScaler disks, IO, data and latency.
EXAScaler nodes have capacity, CPU and memory graphs. The feature matrix also marks health status, performance alerting and hardware event alerting for EXAScaler, and event alerting sends an alert when a device turns red in the global health status dashboard.
Sources: Feature matrix, DDN tab, and Alerting, updated 2026-10-13.
How does XorMon connect to DDN EXAScaler?
XorMon obtains the data from DDN EXAScaler via REST API, from the XorMon host to EXAScaler's DDN Insight on port 443.
The XorMon deployment table lists DDN EXAScaler with a read-only user, REST API as the protocol and port 443.
Sources: installation steps below, updated 2026-11-07, and XorMon deployment.
Key points
- Monitors DDN EXAScaler through the REST API, with access to DDN Insight on port 443.
- SFA: IO, data throughput, latency and block size; EXAScaler disks: IO, data and latency.
- EXAScaler pools and volumes: IO, data, capacity and block size; nodes: capacity, CPU and memory.
- Read-only user, REST API as the protocol, port 443.
- Health status, performance and hardware event alerts, open source license (GPL v3).
Installation and configuration for DDN EXAScaler
Data is obtained from DDN EXAScaler via REST API.- Allow access from the XorMon host to EXAScaler’s Insight on port 443
- Create a new user for XorMon with the Read Only role
- Login to DDN Insight UI
- Go to Manage ➡ Users
- Add a user and assign “Read only” group, select resources for it
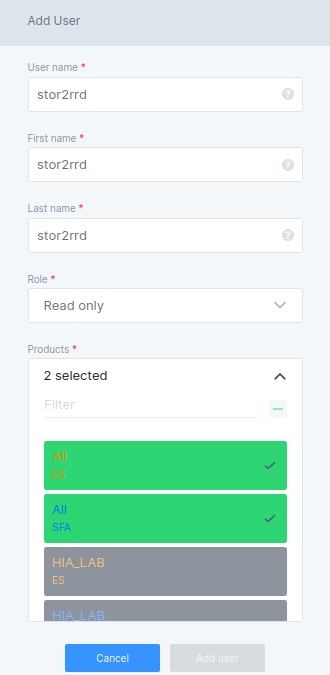
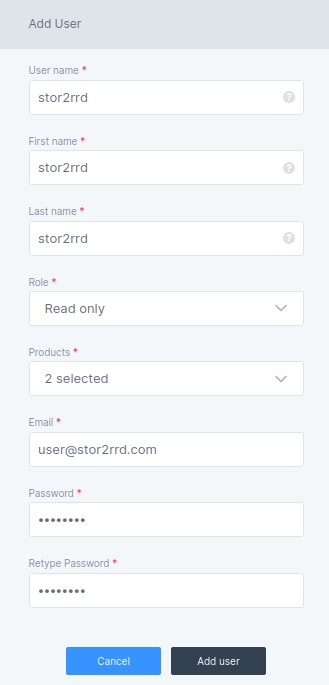
(example uses 'stor2rrd' user but use 'xormon' preferably)
- Create the KariosDB & Influxdb user on DDN Insight via CLI
Use the same credentials as when creating a user via the UIssh [email protected] di-dbuser add -u xormon -p <password>
- Login to DDN Insight UI
-
Add storage device to configuration in the UI:
XorMon UI ➡ Settings icon ➡ Device ➡ Storage ➡ New ➡ Vendor:device ➡ DDN : EXAScaler (due to a bug there might be only IntelliFlash option, use this instead)
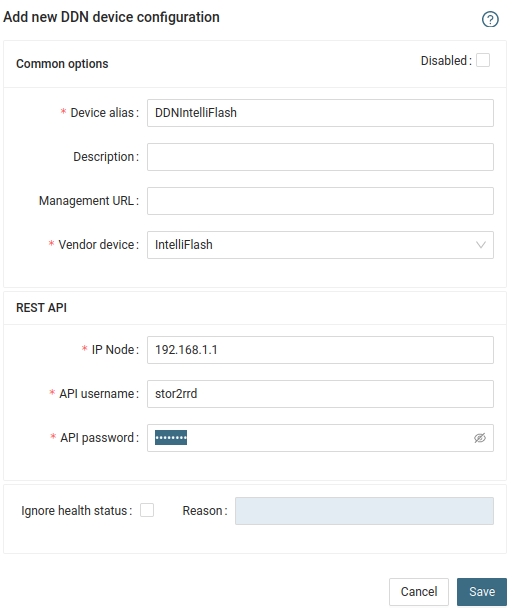
- Run "Test" for configured storage device, it must show "OK"
-
Wait about 1 hour, then reload the web browser, you should see it in XorMon UI
The full list of supported storage systems is on one page.
Dernière mise à jour :