Docker is monitored through the standard "XorMon OS agent" — the same agent used for Linux OS monitoring.
There is no longer a separate Docker container agent (as is with
LPAR2RRD agent)
Once the XorMon OS agent runs on a Docker host and is allowed to read the Docker socket, it collects Docker metrics automatically alongside the OS metrics.
Prerequisites
- The XorMon OS agent installed on each monitored Docker host.See the agent installation guide
- Outbound TCP from the Docker host to the XorMon server on port 8162 (the connection is initiated from the agent side).
- A running Docker daemon with its socket at `/var/run/docker.sock`.
Installation
- Install the XorMon OS agent on a Docker host
Follow the agent installation guide for your distribution
By default the agent installs to `/opt/xormon-agent` and runs as the `xormon` user.
If you installed it under a different user (the `RUN_AS_USER` install variable), use that user name in the next step.
- Grant the agent access to the Docker socket
The agent reads Docker through `/var/run/docker.sock`.
Add the user that runs the agent to the `docker` group so it can access the socket:
sudo usermod -aG docker <user-running-agent>
Replace `<user-running-agent>` with the agent's service user (default: `xormon`).
- Restart the agent
The group change takes effect for new sessions, so restart the agent service:
sudo systemctl restart xormon-agent
XorMon
Wait about an hour for the first data to arrive, then refresh the web browser cache with Ctrl-F5.
Your Docker hosts and containers will appear in the UI.
Notes
- Adding the agent user to the `docker` group grants it access to the Docker API.
This is the standard requirement for non-root Docker access; apply it only on hosts you intend to monitor.
- No extra container needs to be deployed — Docker metrics are collected by the same OS agent that reports CPU, memory, network and other OS metrics.
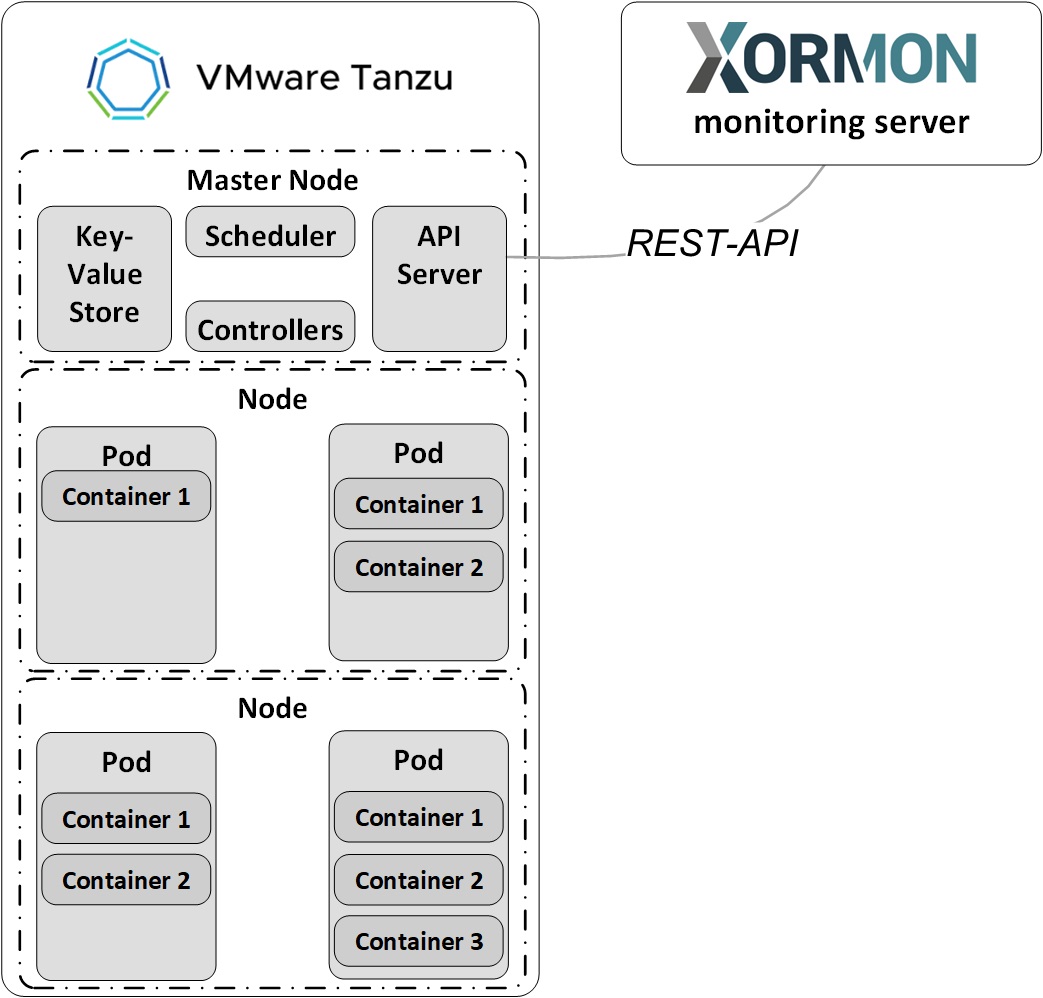
Data is obtained from VMware Tanzu API & VMware Tanzu Metrics server API
Create xormon ServiceAccount, ClusterRole, Binding and Access Token
Create file xormon.yaml with this content:
apiVersion: v1
kind: ServiceAccount
metadata:
  name: xormon
  namespace: default

---

apiVersion: rbac.authorization.k8s.io/v1
kind: ClusterRole
metadata:
  name: xormon
rules:
- apiGroups: ["","metrics.k8s.io","apps","batch"]
  resources: ["pods","nodes","services","nodes/proxy", "endpoints", "namespaces", "replicasets", "jobs","cronjobs", "statefulsets", "daemonsets", "events","deployments"]
  verbs: ["get", "watch", "list"]
- nonResourceURLs: ["/metrics"]
  verbs: ["get"]


---

apiVersion: rbac.authorization.k8s.io/v1
kind: ClusterRoleBinding
metadata:
  name: xormon
subjects:
- kind: ServiceAccount
  name: xormon
  namespace: default
roleRef:
  apiGroup: rbac.authorization.k8s.io
  kind: ClusterRole
  name: xormon

---

apiVersion: v1
kind: Secret
metadata:
  name: xormon-token
  annotations:
    kubernetes.io/service-account.name: xormon
type: kubernetes.io/service-account-token
Apply it by:
$ kubectl apply -f xormon.yaml
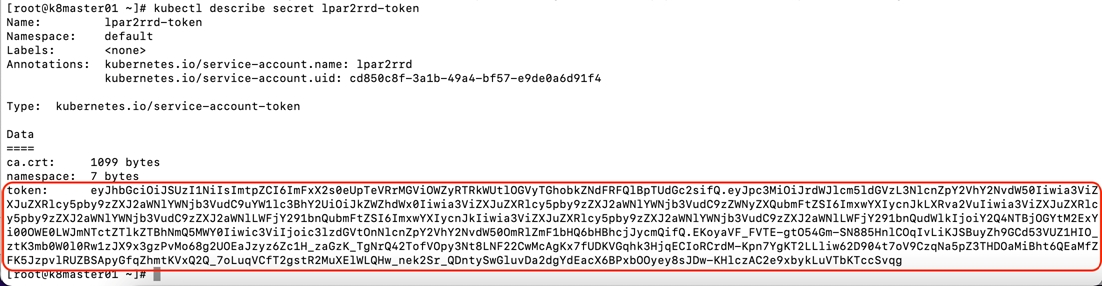
Get xormon token
$ kubectl describe secret xormon-token
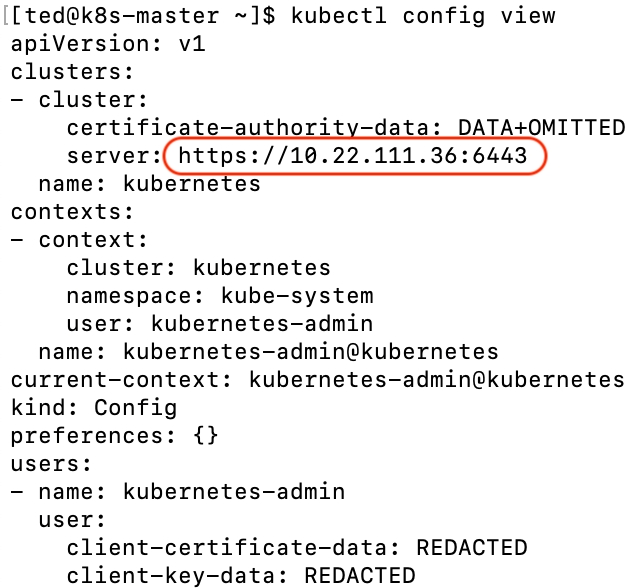
Get cluster endpoint
$ kubectl config view
Get cluster endpoint
$ kubectl config view
Configure VMware Tanzu in XorMon
-
XorMon UI ➡ Device ➡ Container ➡ VMware Tanzu ➡ New
- Run "Test" for configured VMware Tanzu host, it must show "OK"
-
Wait about 1 hour, then refresh the web browser cache by Ctrl-F5
Kubectl install
The instructions below are for installation via the
kubectl command line
Create a xormon service account
Create file xormon-service-account.yaml with this content
apiVersion: v1
kind: ServiceAccount
metadata:
  name: xormon
  namespace: default

---

apiVersion: rbac.authorization.k8s.io/v1
kind: ClusterRole
metadata:
  name: xormon
rules:
- apiGroups: ["","metrics.k8s.io", "kubevirt.io", "apps", "batch"]
  resources: ["pods","nodes","services","nodes/proxy", "endpoints", "namespaces", "virtualmachines", "virtualmachineinstances", "replicasets", "jobs","cronjobs", "statefulsets", "daemonsets", "events","deployments"]
  verbs: ["get", "watch", "list"]
- nonResourceURLs: ["/metrics"]
  verbs: ["get"]

---

apiVersion: rbac.authorization.k8s.io/v1
kind: ClusterRoleBinding
metadata:
  name: xormon
subjects:
- kind: ServiceAccount
  name: xormon
  namespace: default
roleRef:
  apiGroup: rbac.authorization.k8s.io
  kind: ClusterRole
  name: xormon

---

apiVersion: rbac.authorization.k8s.io/v1
kind: ClusterRoleBinding
metadata:
  name: xormon-prometheus
subjects:
- kind: ServiceAccount
  name: xormon
  namespace: default
roleRef:
  apiGroup: rbac.authorization.k8s.io
  kind: ClusterRole
  name: cluster-monitoring-view

---

apiVersion: v1
kind: Secret
metadata:
  name: xormon-token
  annotations:
    kubernetes.io/service-account.name: xormon
type: kubernetes.io/service-account-token
Apply it by:
oc apply -f xormon-service-account.yaml
Get service account token
oc describe secret xormon-token
Get cluster endpoint
$ kubectl config view
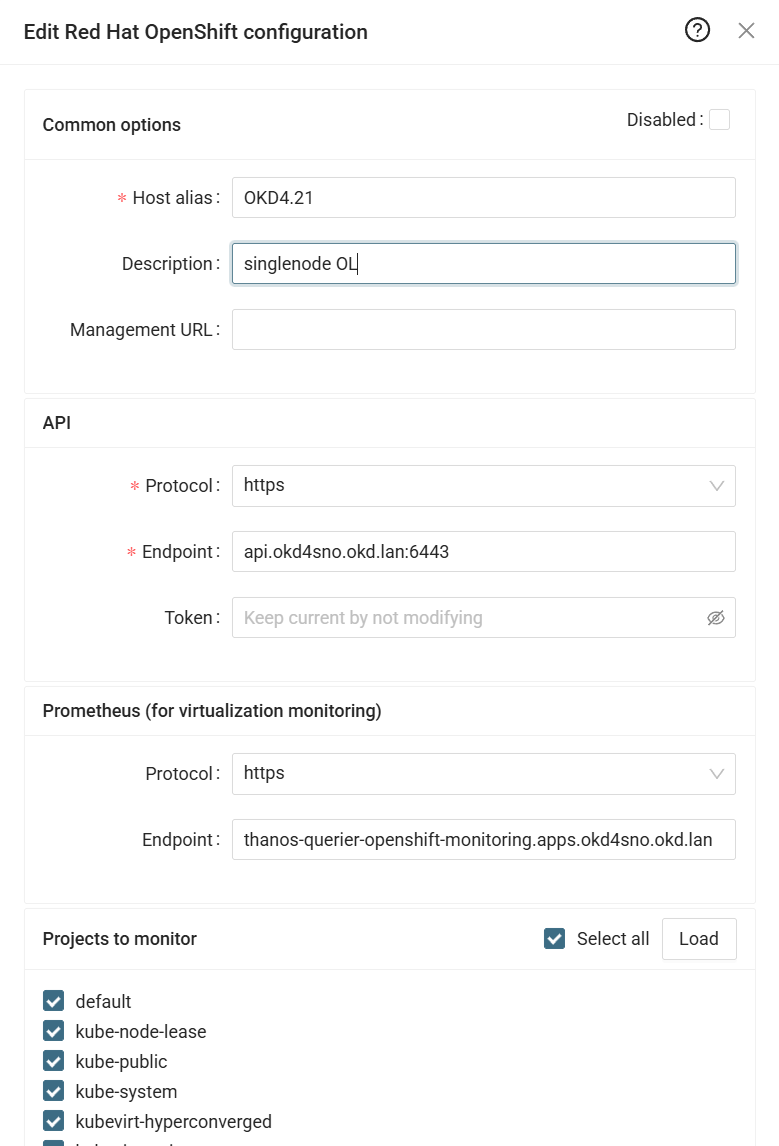
Configure RedHat OpenShift in XorMon
-
XorMon UI ➡ Device ➡ Conteiner ➡RedHat OpenShift ➡ New
- Run "Test" for configured OpenShift host, it must show "OK"
-
Wait about 1 hour, then refresh the web browser cache by Ctrl-F5
Docker monitoring is performed via the OS agent in a container. Deploy the agent on each monitored Docker host.
Prerequisites
- Opened TCP communication between each Docker server and XorMon server on port
8162.
Connections are initiated from Docker server side.
Docker agent installation
- Pull the image
docker pull xorux/lpar2rrd-docker-agent
- Run the docker agent
docker run --init -d --hostname $(hostname) --name lpar2rrd-docker-agent -v /var/run/docker.sock:/var/run/docker.sock:ro --env XORMON=<XorMon-NG_hostname/IP> xorux/lpar2rrd-docker-agent
XorMon
- Wait about 1 hour, then refresh the web browser cache by Ctrl-F5
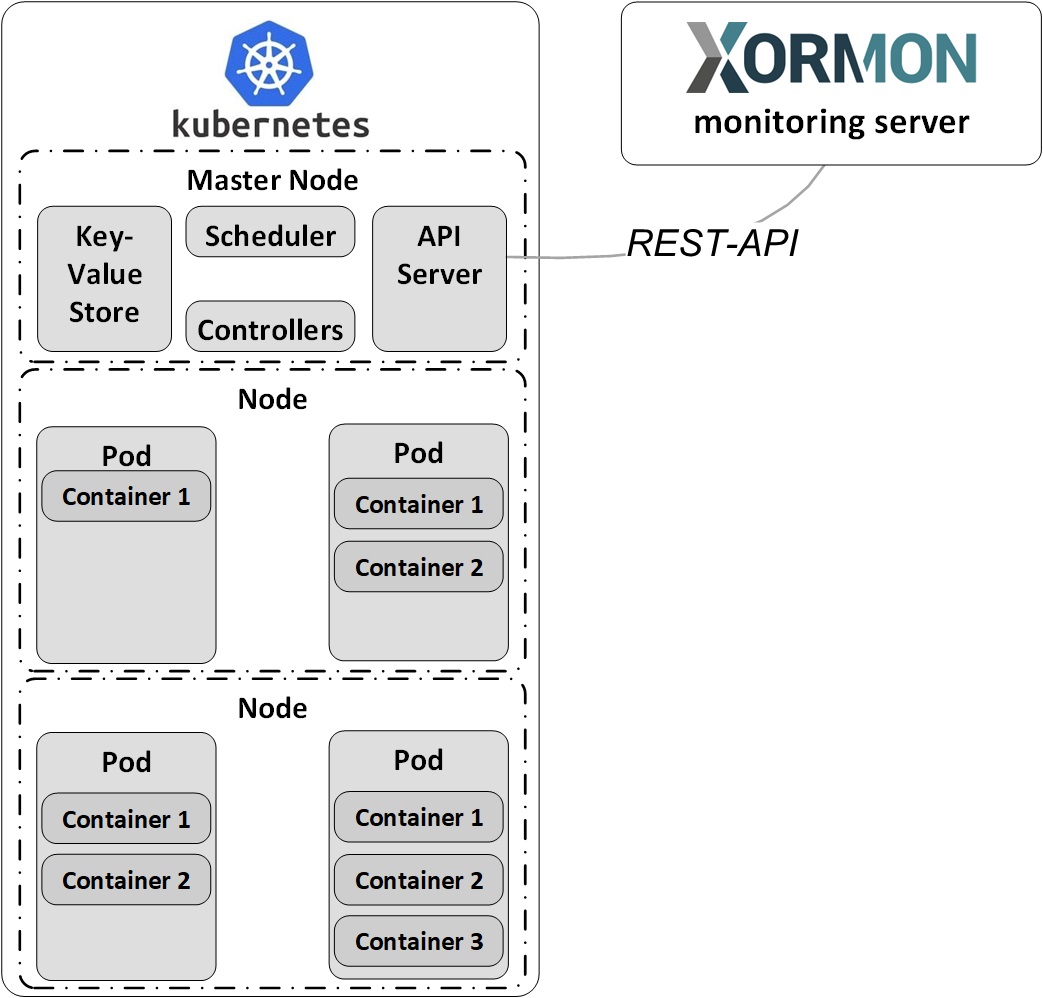
Data is obtained from Kubernetes API & Kubernetes Metrics server API
Create xormon ServiceAccount, ClusterRole, Binding and Access Token
Create file xormon.yaml with this content:
apiVersion: v1
kind: ServiceAccount
metadata:
  name: xormon
  namespace: default

---

apiVersion: rbac.authorization.k8s.io/v1
kind: ClusterRole
metadata:
  name: xormon
rules:
- apiGroups: ["","metrics.k8s.io","apps","batch"]
  resources: ["pods","nodes","services","nodes/proxy", "endpoints", "namespaces", "replicasets", "jobs","cronjobs", "statefulsets", "daemonsets", "events","deployments"]
  verbs: ["get", "watch", "list"]
- nonResourceURLs: ["/metrics"]
  verbs: ["get"]


---

apiVersion: rbac.authorization.k8s.io/v1
kind: ClusterRoleBinding
metadata:
  name: xormon
subjects:
- kind: ServiceAccount
  name: xormon
  namespace: default
roleRef:
  apiGroup: rbac.authorization.k8s.io
  kind: ClusterRole
  name: xormon

---

apiVersion: v1
kind: Secret
metadata:
  name: xormon-token
  annotations:
    kubernetes.io/service-account.name: xormon
type: kubernetes.io/service-account-token
Apply it by:
$ kubectl apply -f xormon.yaml
Get xormon token
$ kubectl describe secret xormon-token
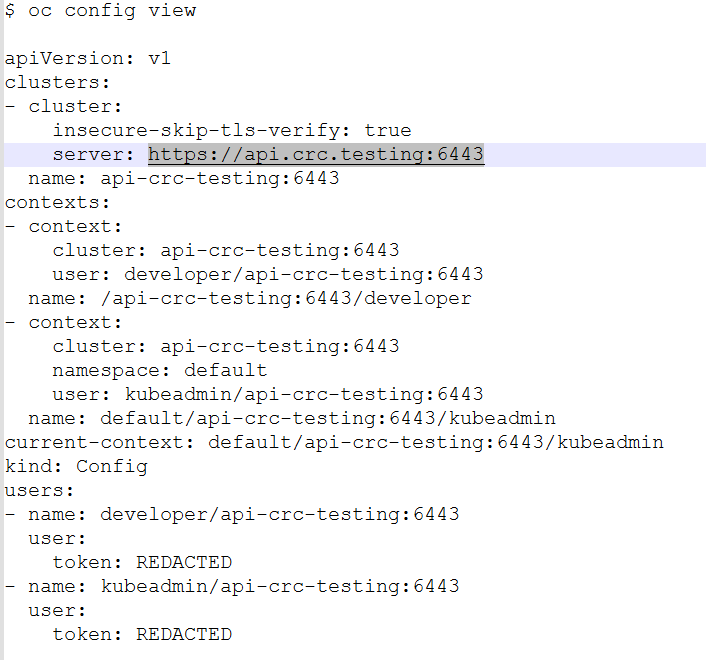
Get cluster endpoint
$ kubectl config view
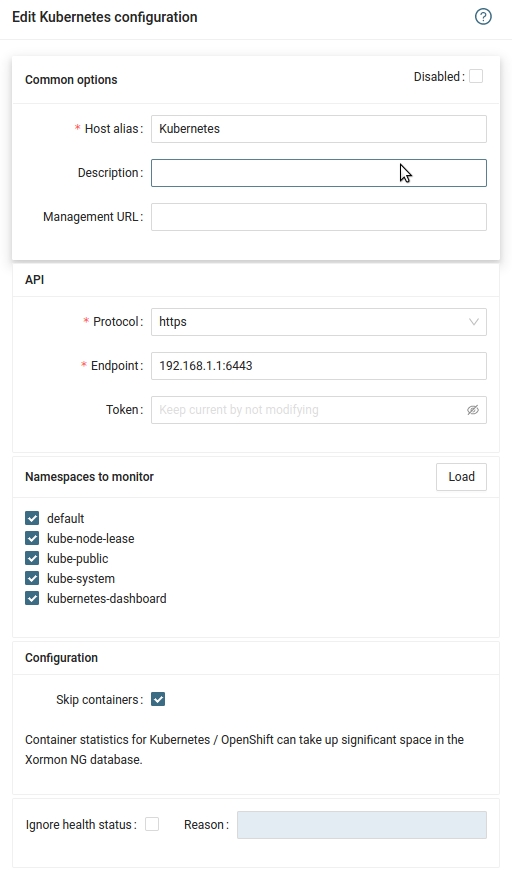
Configure Kubernetes in XorMon
-
XorMon UI ➡ Device ➡ Container ➡ Kubernetes ➡ New
- Run "Test" for configured Kubernetes host, it must show "OK"
-
Wait about 1 hour, then refresh the web browser cache by Ctrl-F5
 ¨
¨