Ceph Monitoring
Ceph version 14.2 (Nautilus) and newer are supported.
For how health checks affect device status and optional per-device tuning, see Ceph health monitoring.
Enable Prometheus export module
ceph mgr module enable prometheusEnable Pool metrics
Selected pools
ceph config set mgr mgr/prometheus/rbd_stats_pools "pool1,pool2,poolN"All pools
ceph config set mgr mgr/prometheus/rbd_stats_pools "*"Enable performance counters in Prometheus
With the introduction of ceph-exporter daemon, the Prometheus module will no longer export Ceph daemon perf counters as prometheus metrics by default.
However, one may re-enable exporting these metrics by setting the module option exclude_perf_counters to false:
ceph config set mgr mgr/prometheus/exclude_perf_counters falseConfigure firewall
Enable access to Prometheus export module from XorMon.
By default module accepts HTTP requests on port 9283.
XorMon storage configuration
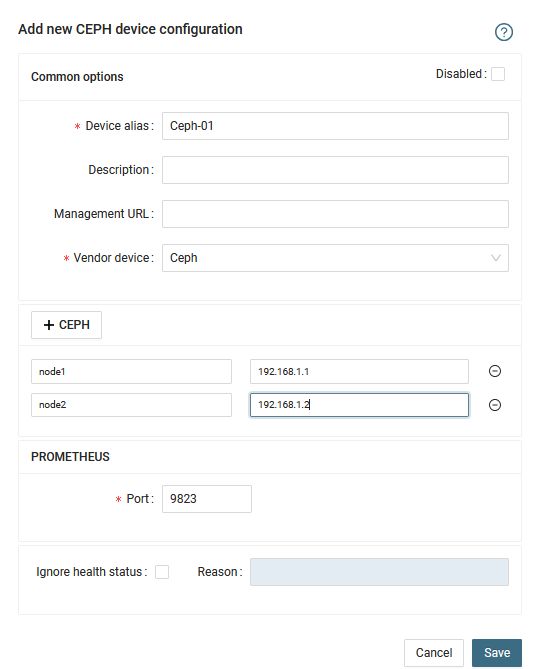
- Configure hostnames/IPs
If you are using a load balancer translating hostname to an active manager node, then you can fill in only the load balanced hostname.
Otherwise, fill in IP addresses/hostnames of all CEPH manager nodes which can host the Prometheus module.
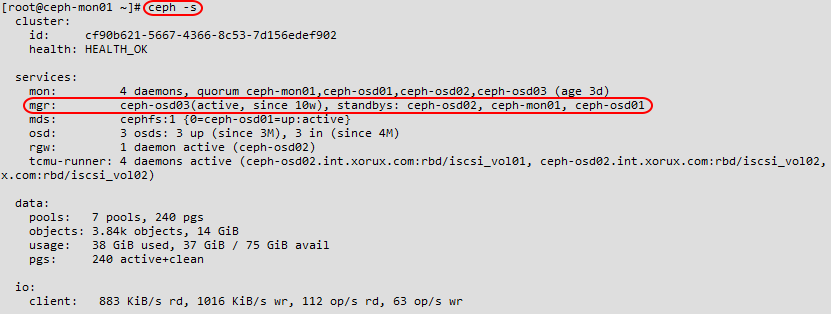
You cen get a list of manager nodes from "ceph -s" command.
-
Add storage into configuration from the UI:
XorMon UI ➡ Settings icon ➡ Device ➡ Storage ➡ New ➡ Vendor:device ➡ Ceph
- Run "Test" for configured storage device, it must show "OK"
-
Wait about 1 hour, then reload the web browser, you should see it in XorMon UI