HPE ESL G3 tape libraries are supported.
Connect them as Quantum Scalar, they are rebrands.
Fujitsu Storage Scalar tape libraries are supported.
Connect them as Quantum Scalar, they are rebrands.
Dell EMC² ML3 tape libraries are supported.
Connect them as IBM TS 4300, they are rebrands.
Overland Storage NEO 200s/400s G2 are IBM TS3100/3200 rebrands
Implementation is done through the SNMP protocol. Tape libraries however providing just limited set of data through that protocol.
Monitored scope
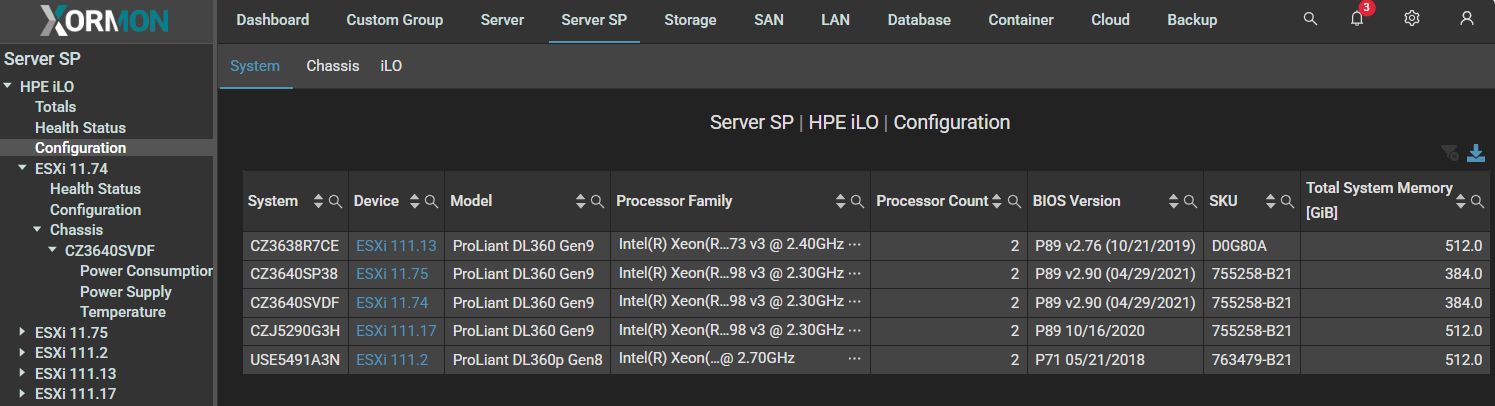
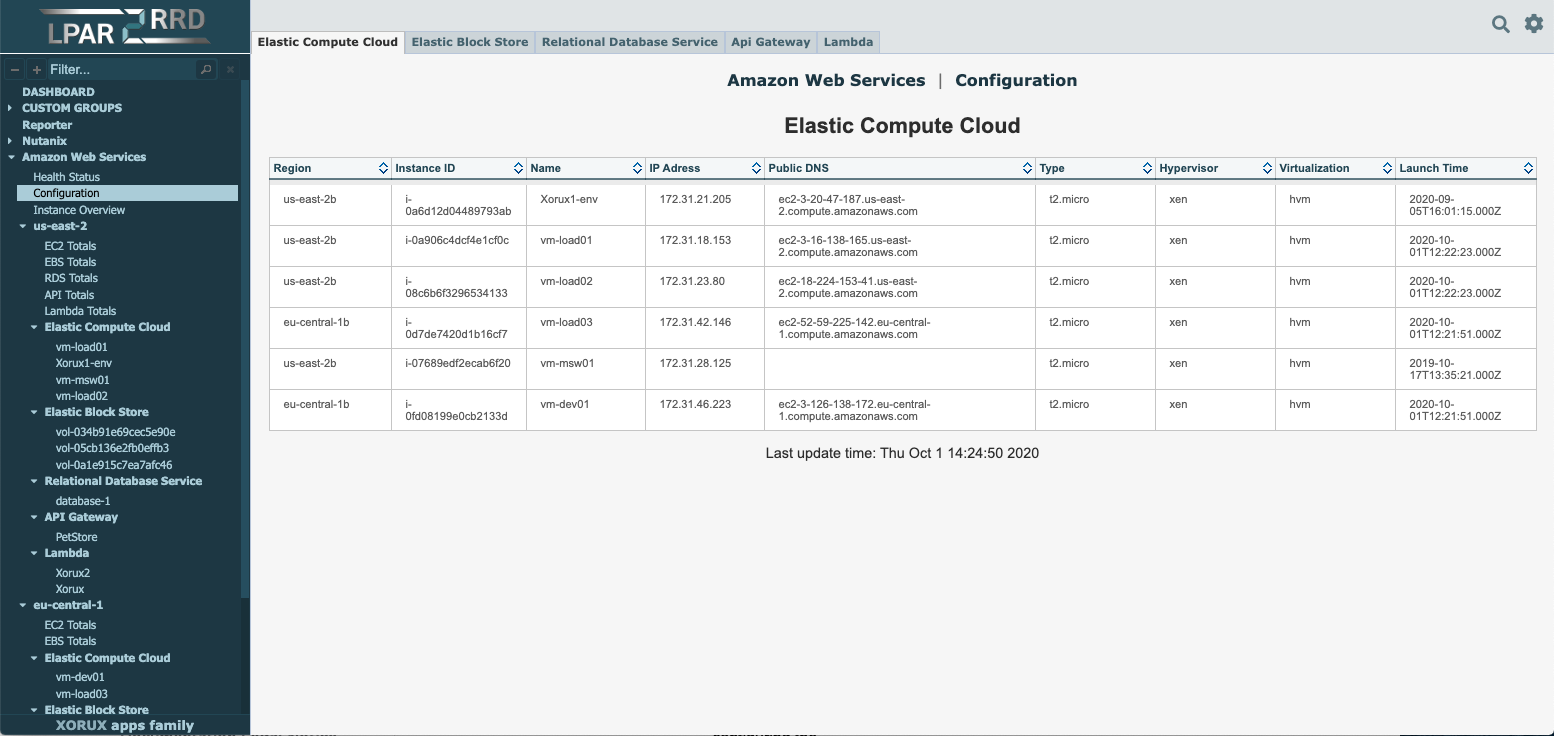
- Configuration
- Health status
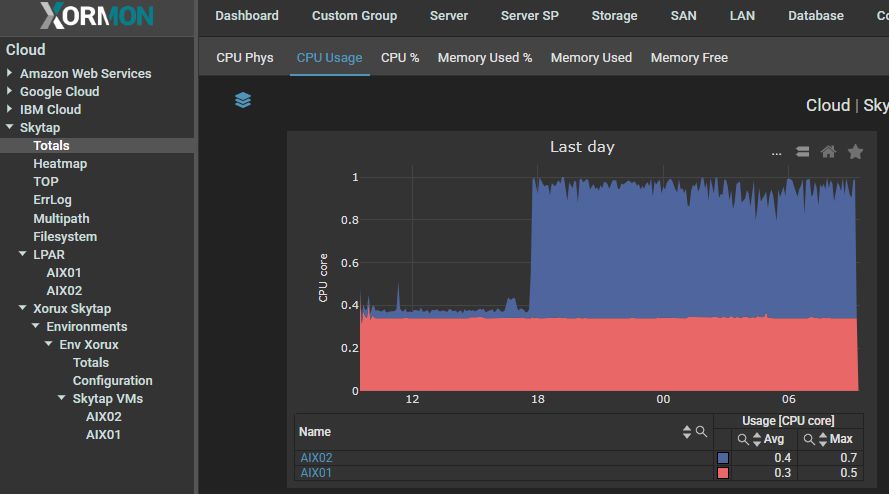
- Drive usage in the time
- Drive configuration
- Slot configuration
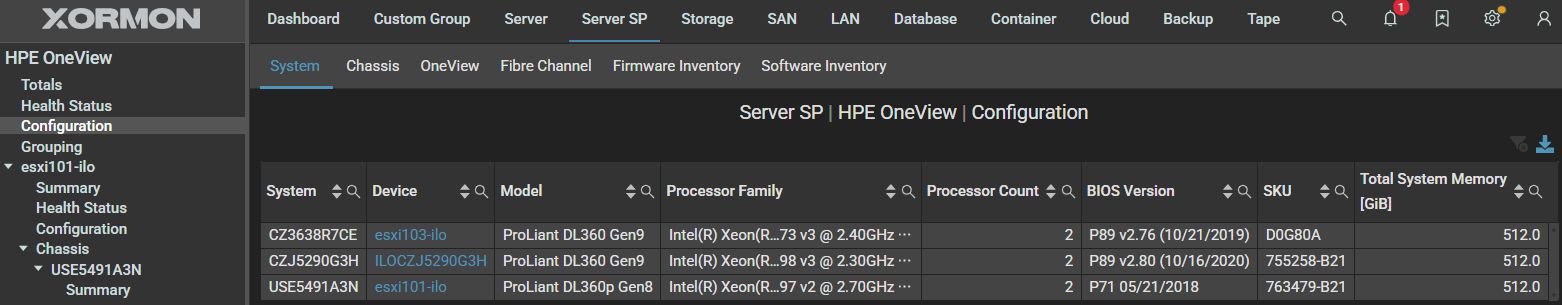
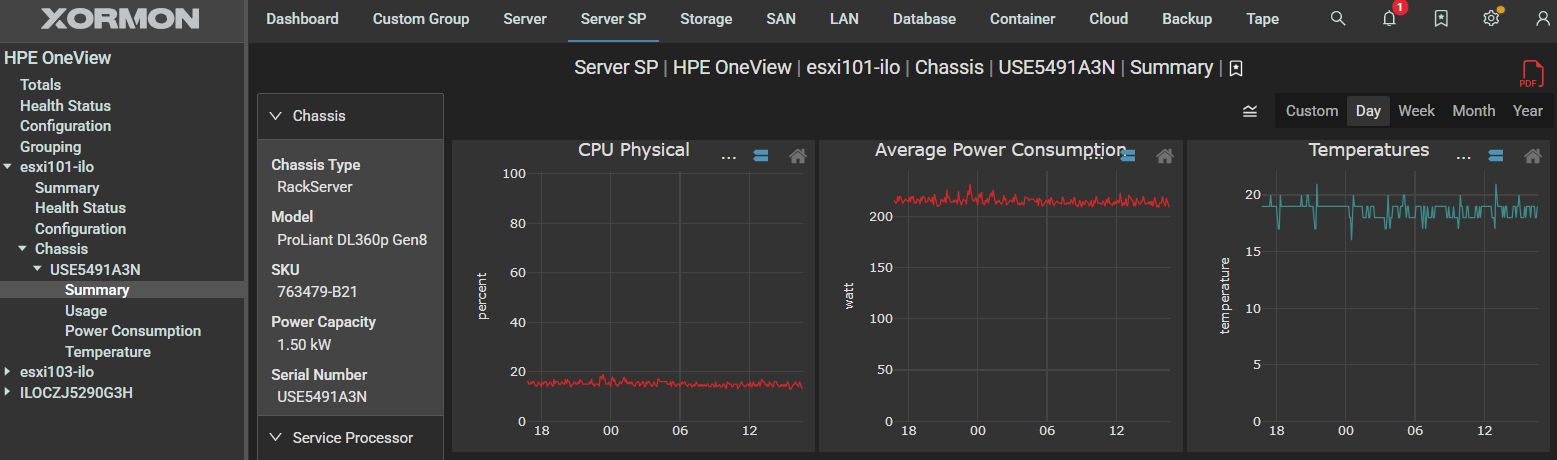
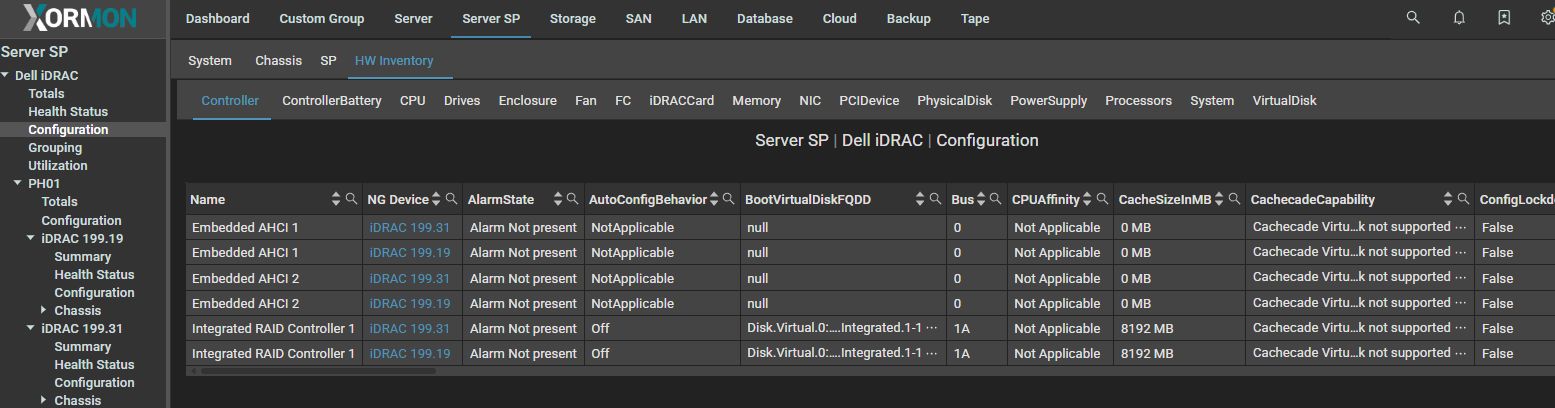
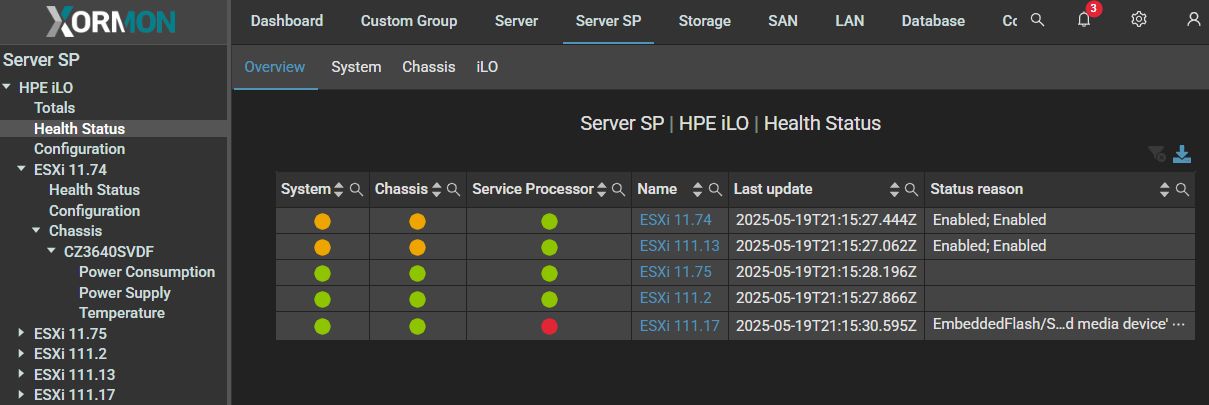
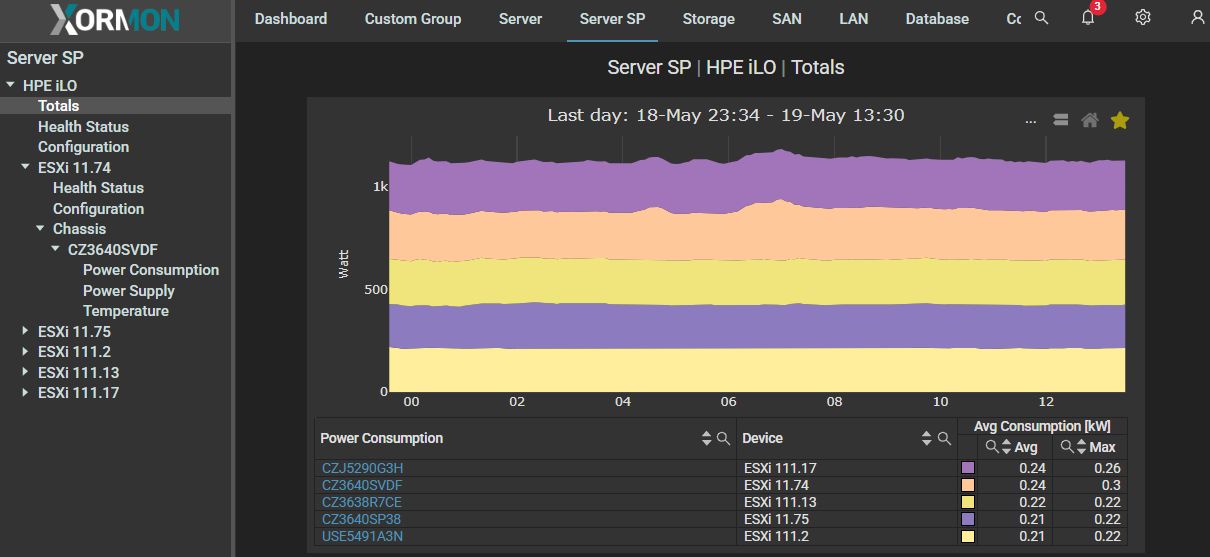
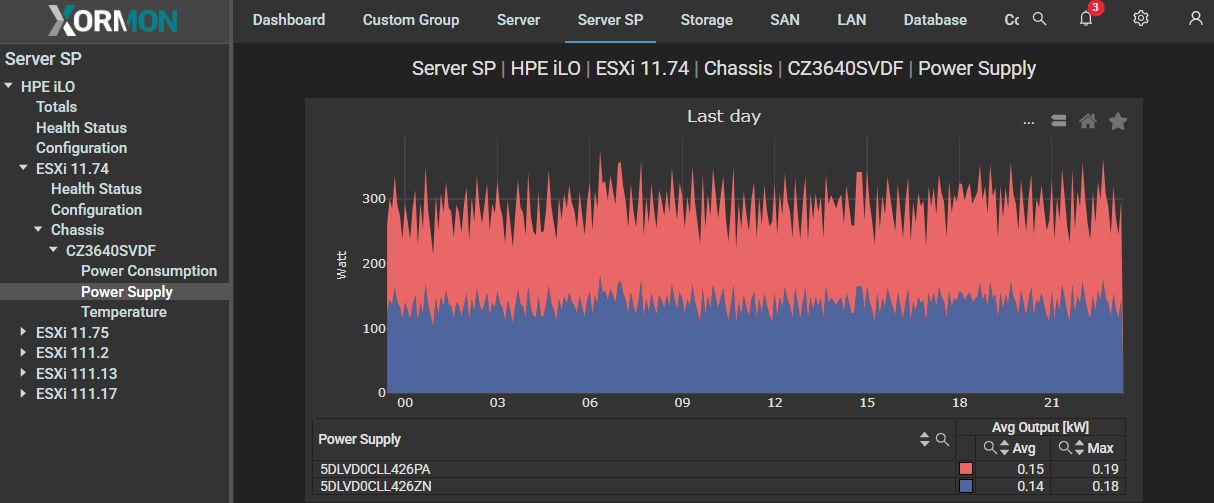
Examples
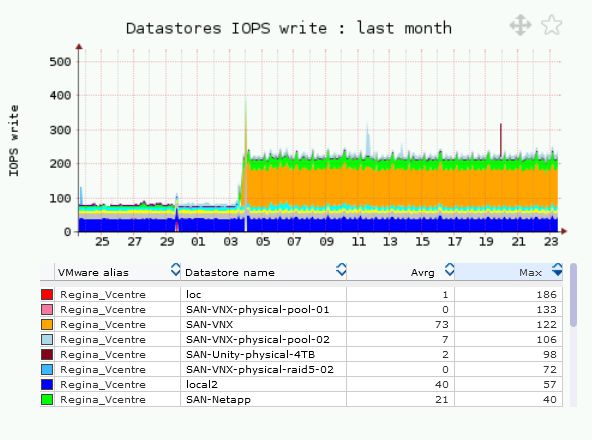
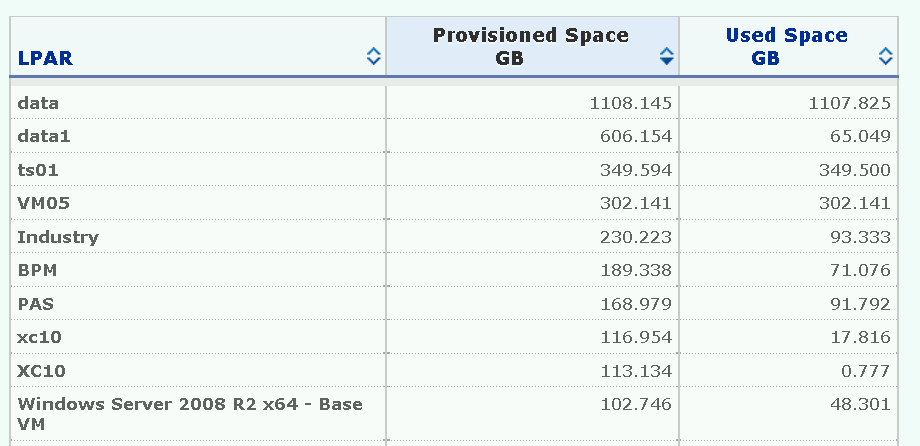
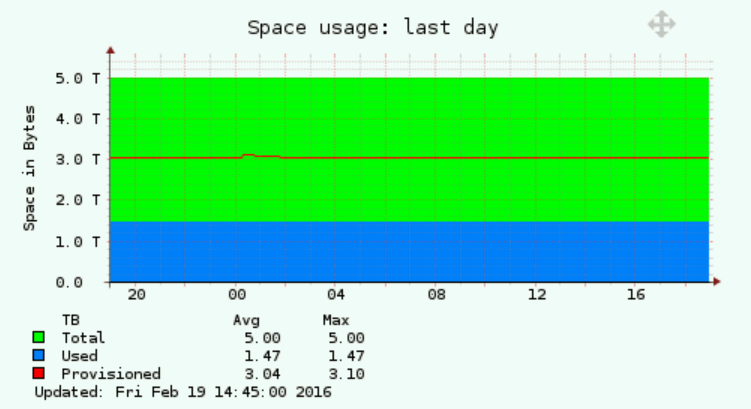
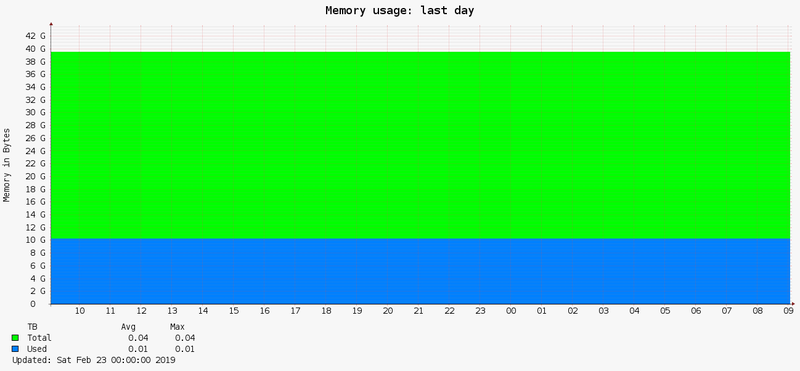
Summary
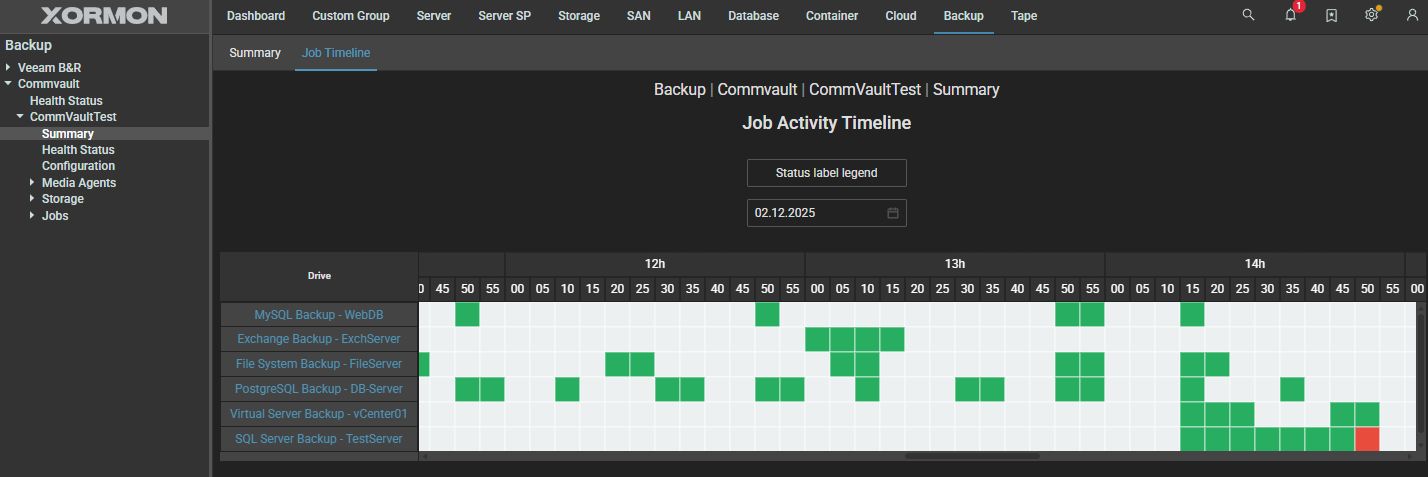
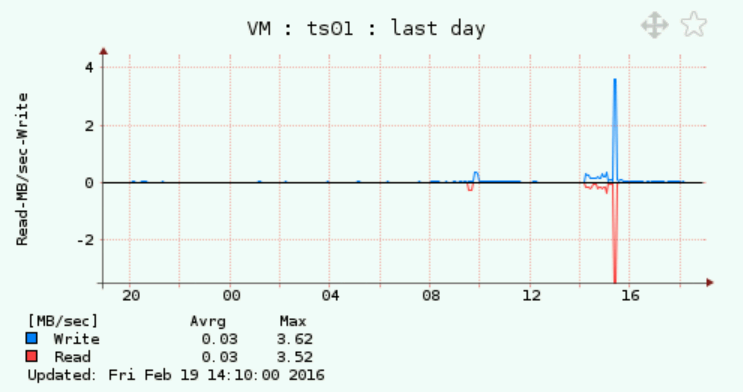
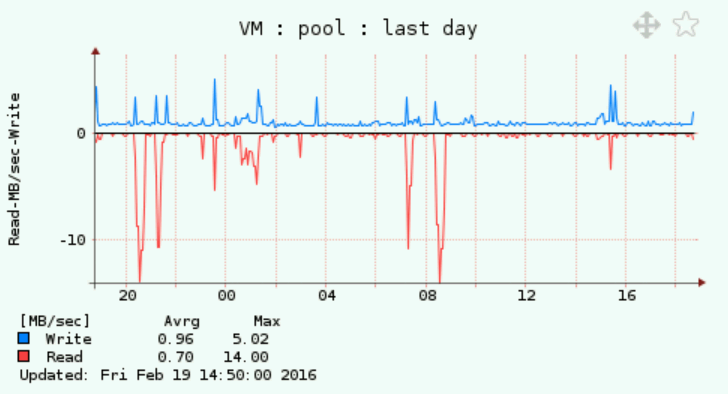
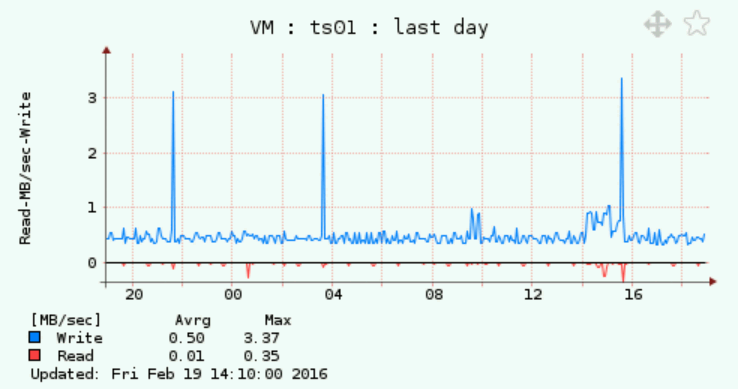
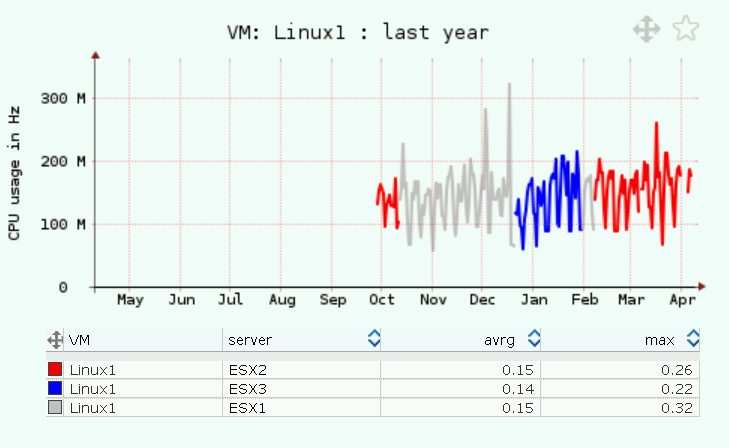
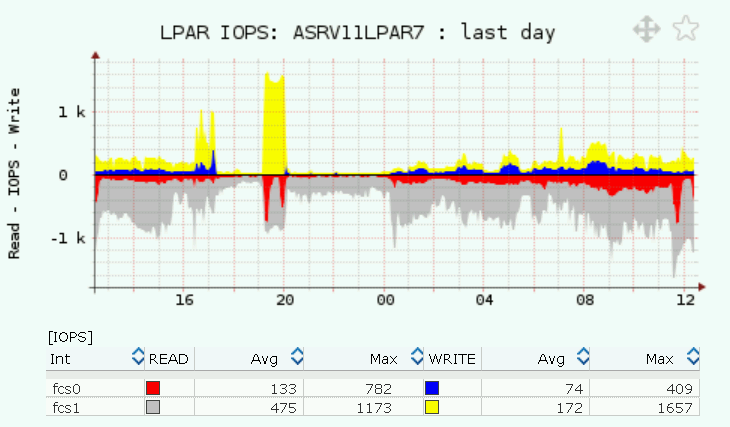
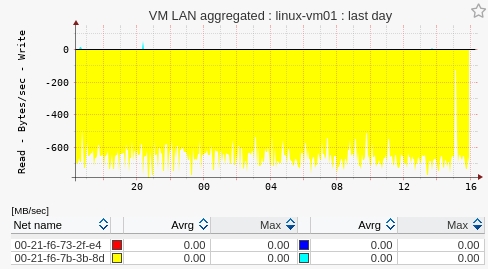
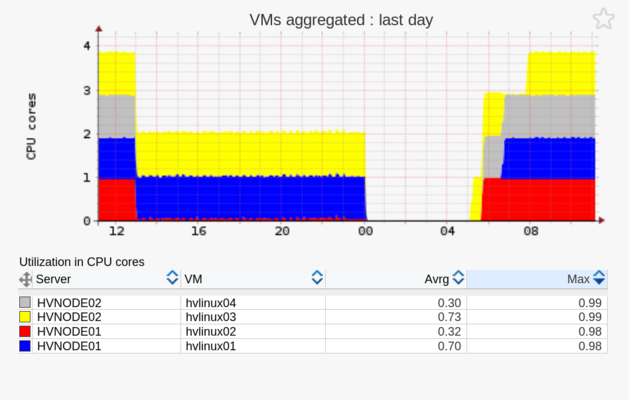
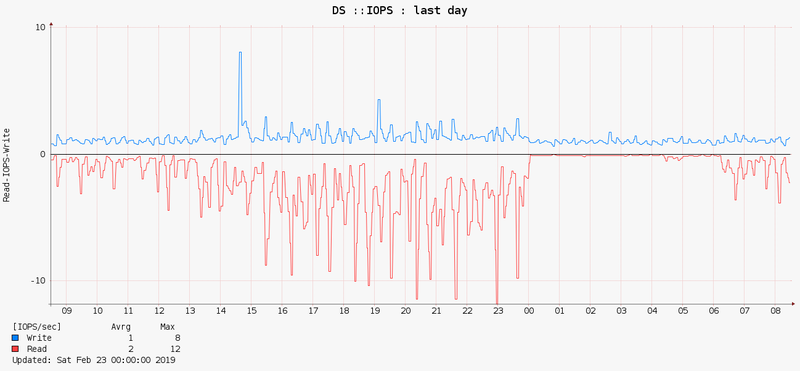
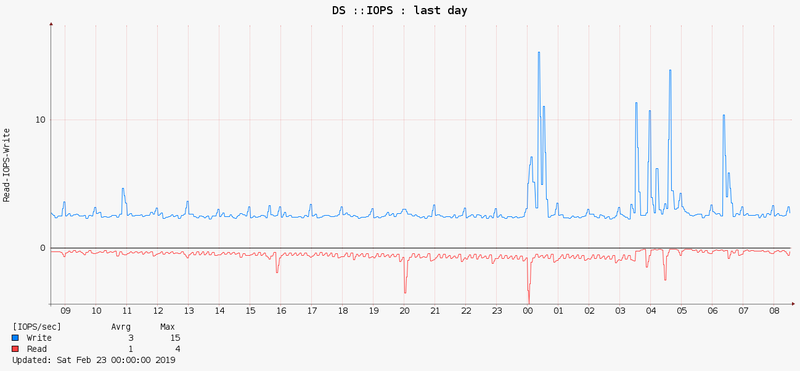
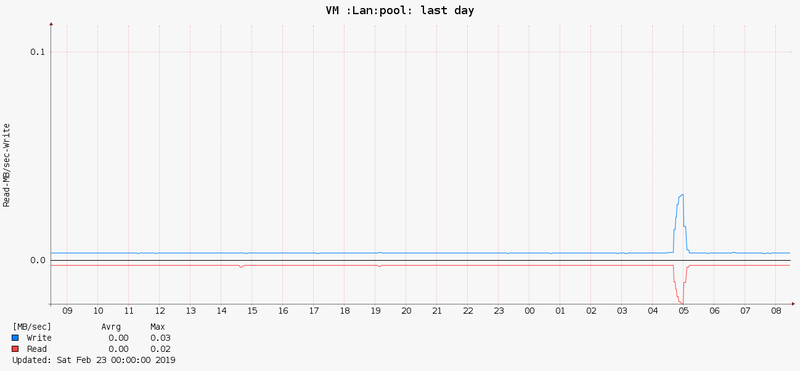
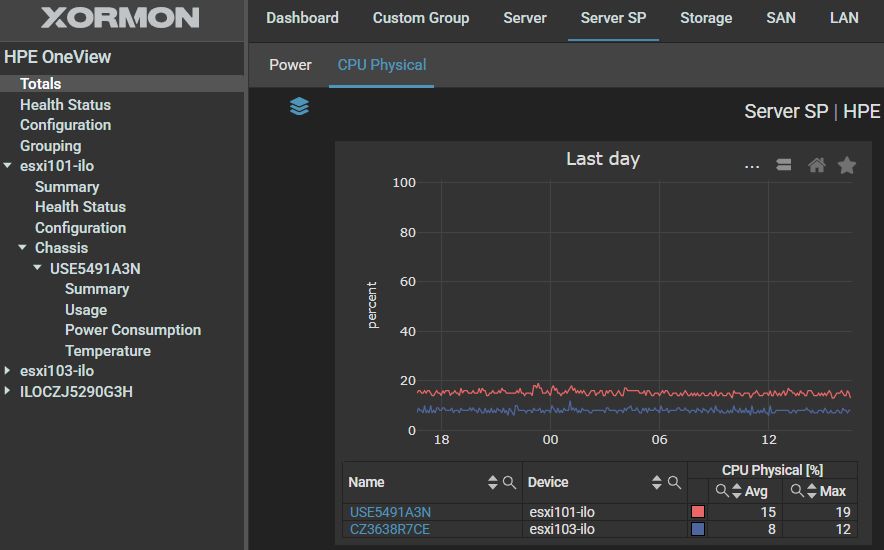
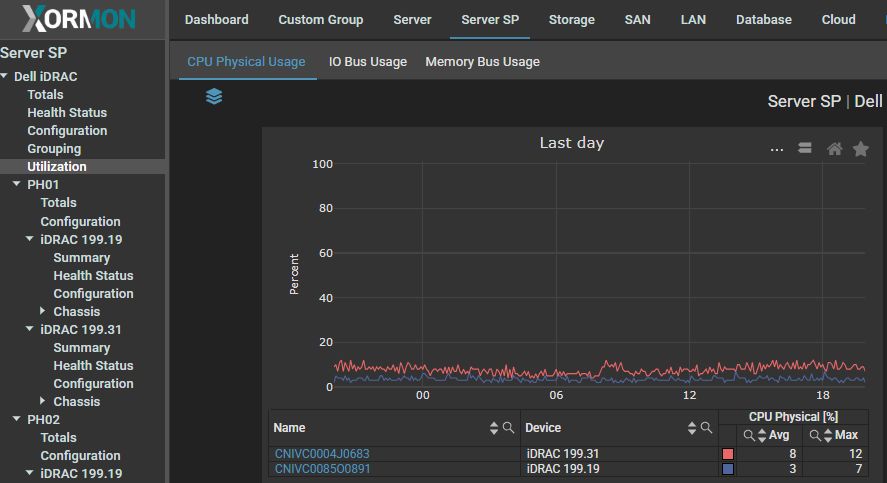
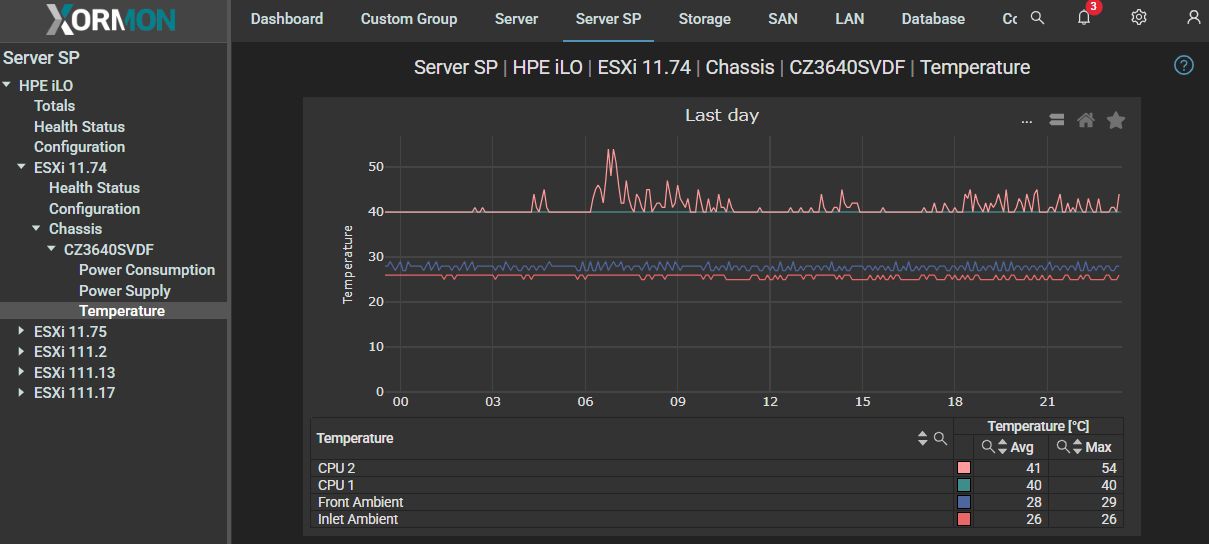
Drive usage
Dell PowerVault TL2000/TL4000 are IBM TS3100/3200 rebrands
Implementation is done through the SNMP protocol. Tape libraries however providing just limited set of data through that protocol.
Monitored scope
- Configuration
- Health status
- Drive usage in the time
- Drive configuration
- Slot configuration
Examples
Summary
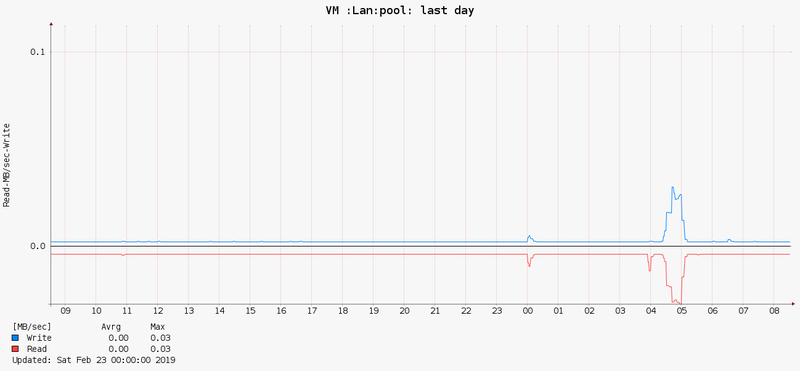
Drive usage
Imation LR1200/LR1400 are IBM TS3100/3200 rebrands
Implementation is done through the SNMP protocol. Tape libraries however providing just limited set of data through that protocol.
Monitored scope
- Configuration
- Health status
- Drive usage in the time
- Drive configuration
- Slot configuration
Examples
Summary
Drive usage
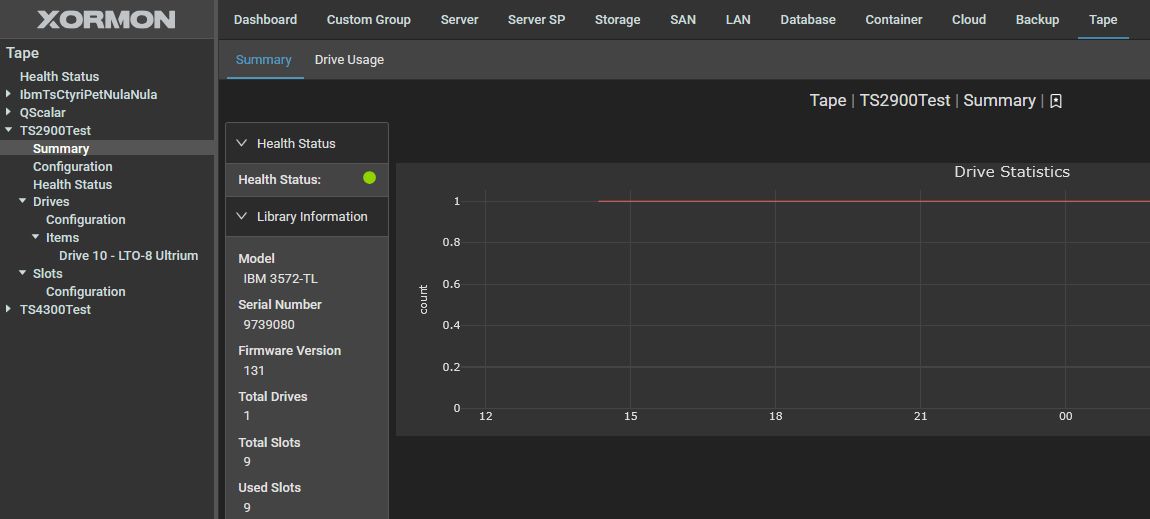
IBM TS2k and TS3k tape libraries do not support REST API.
Implementation is done through the SNMP protocol. Tape libraries however providing just limited set of data through that protocol, therefore persented data set is not so rich as for IBM TS4k.
Monitored scope
- Configuration
- Health status
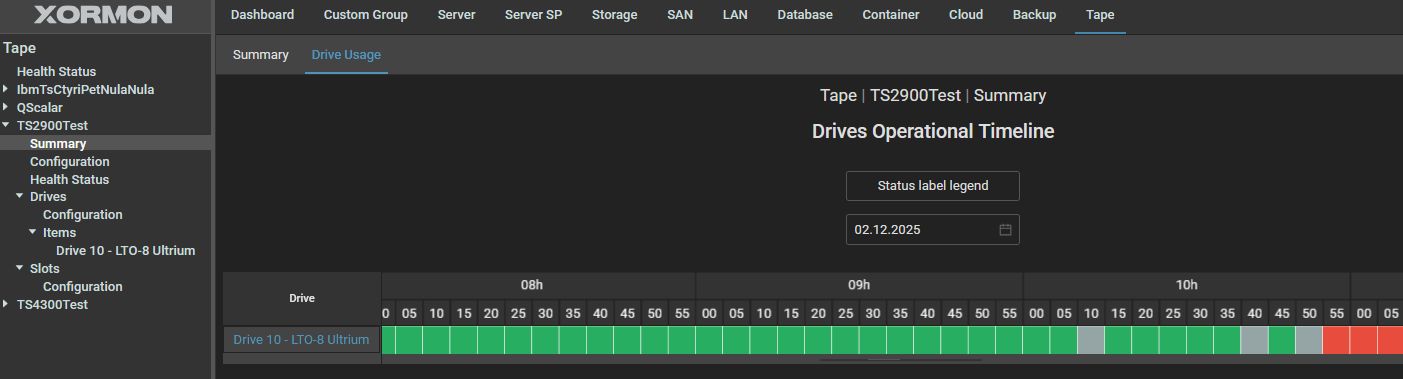
- Drive usage in the time
- Drive configuration
- Slot configuration
Examples
Summary
Drive usage
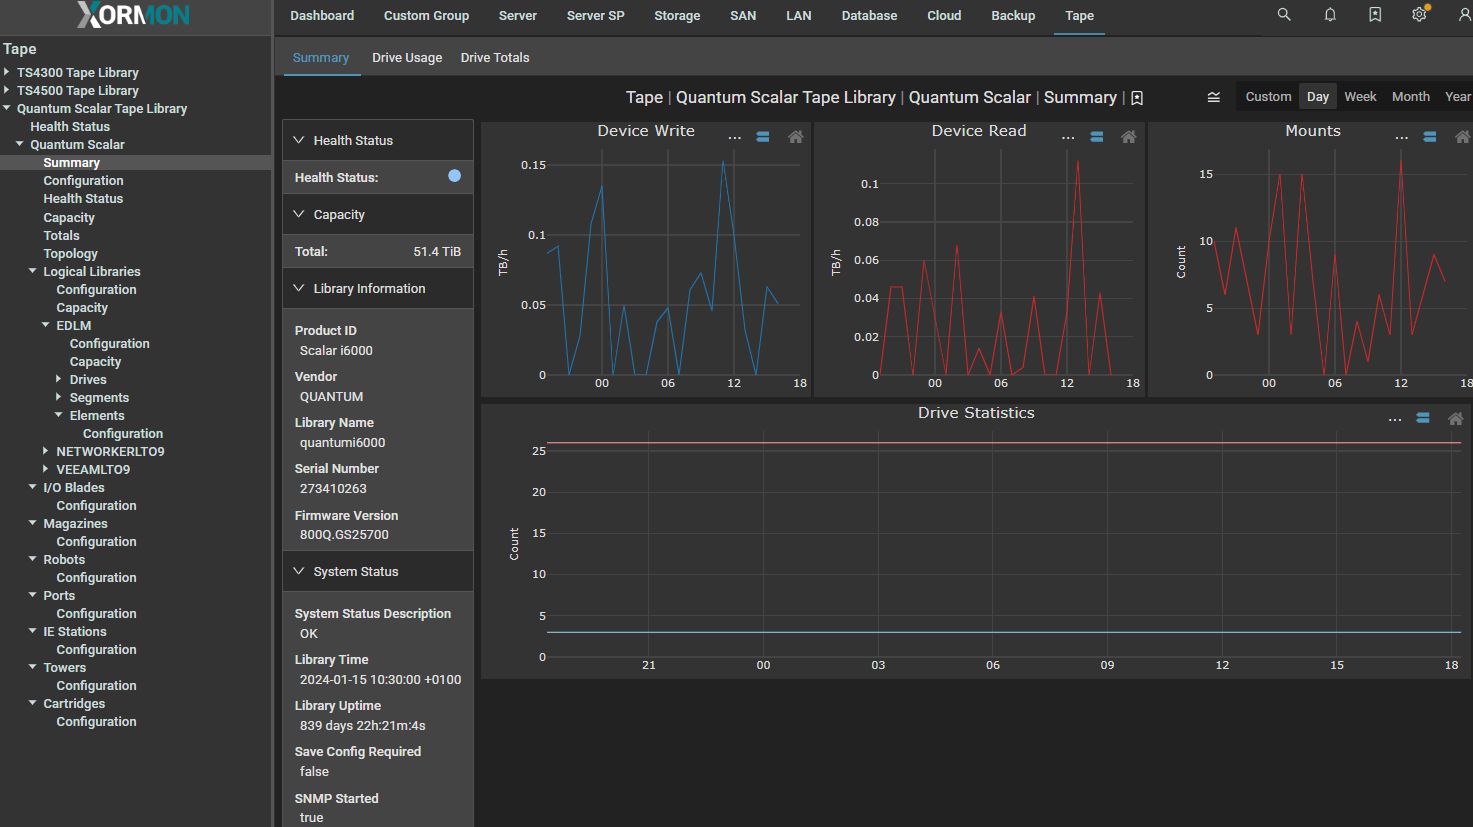
The product supports all Quantum Scalar libraries which have REST API available.
Data is obtained from via tape library REST API.
Monitored scope
- Health status:
- All HW components
- Event log
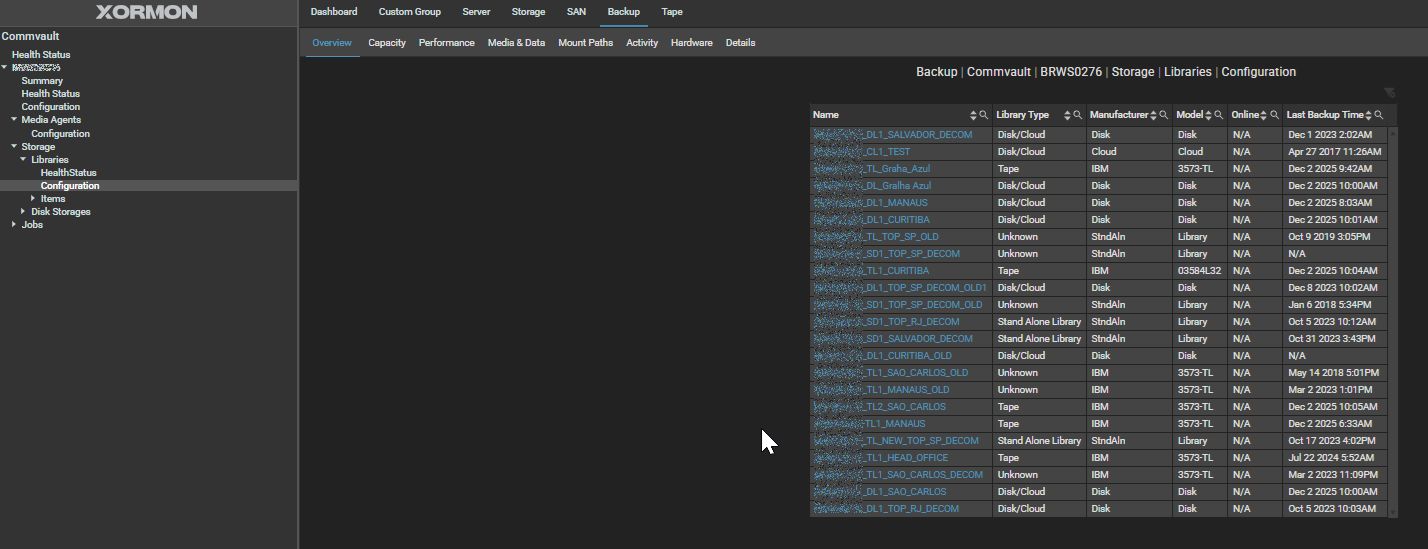
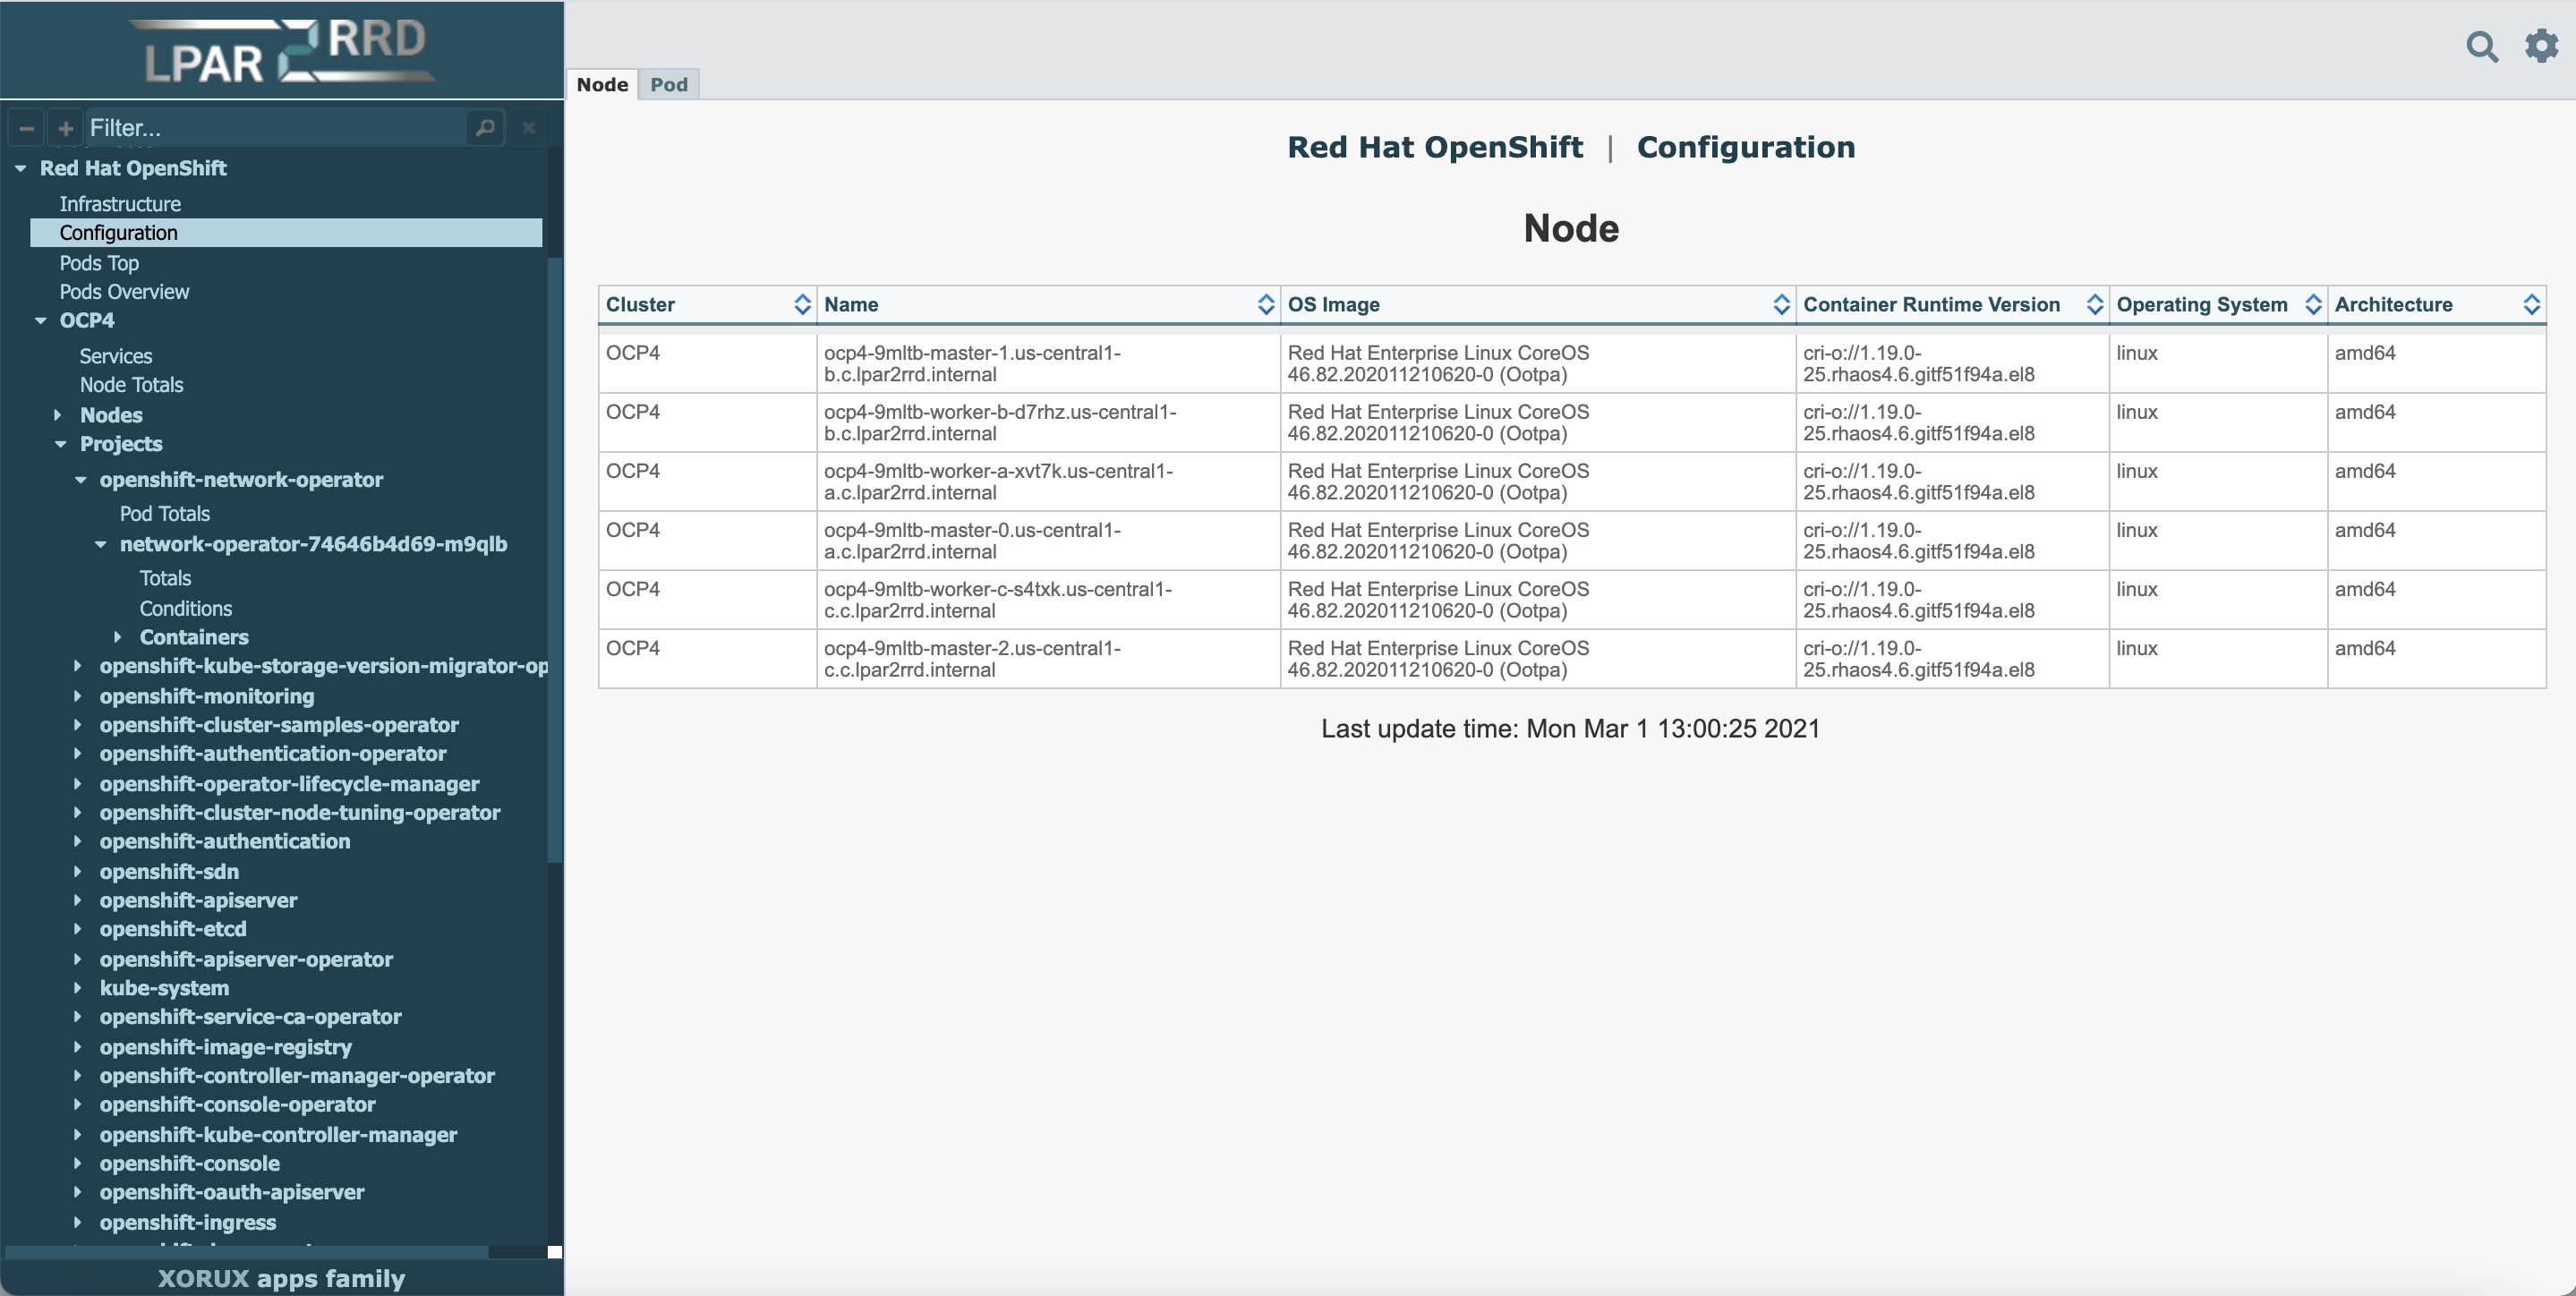
- Configuration: complete configuration, all components
- Capacity total and compressed
- Performance
- Data read
- Data write)
- Tape mounts
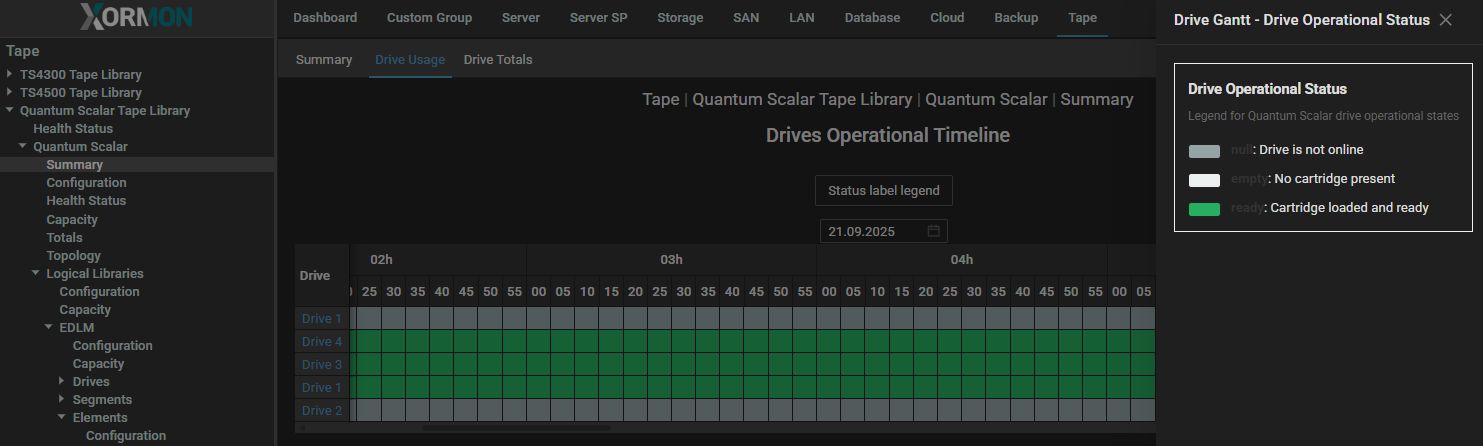
- Drive usage in time
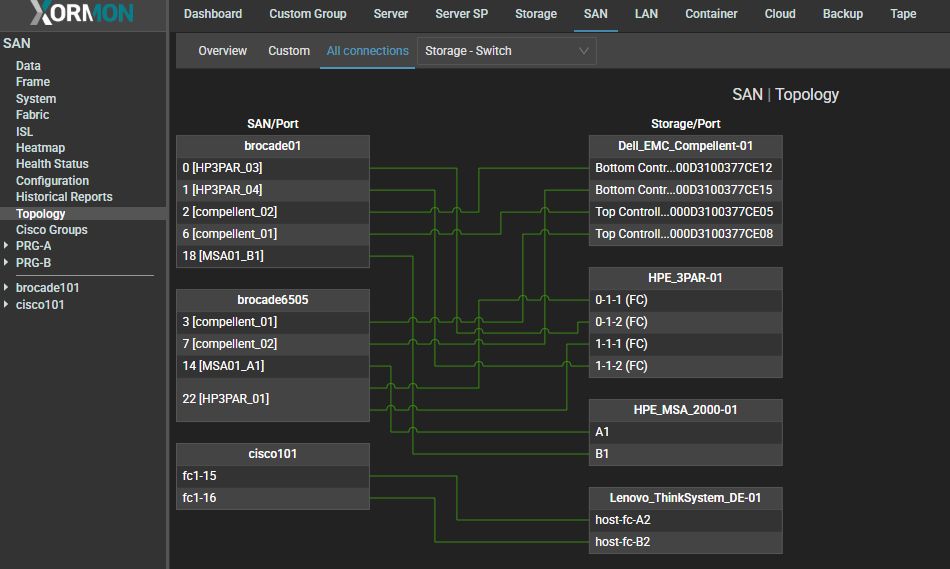
- Topology
- Logical Libraries
- Configuration
- Capacity
- Drives
- Segments
- Elements
- Robots: configuration
- I/O blades: configuration
- Magazines: configuration
- Ports: configuration
- IE Stations: configuration
- Towers: configuration
- Cartriges: configuration
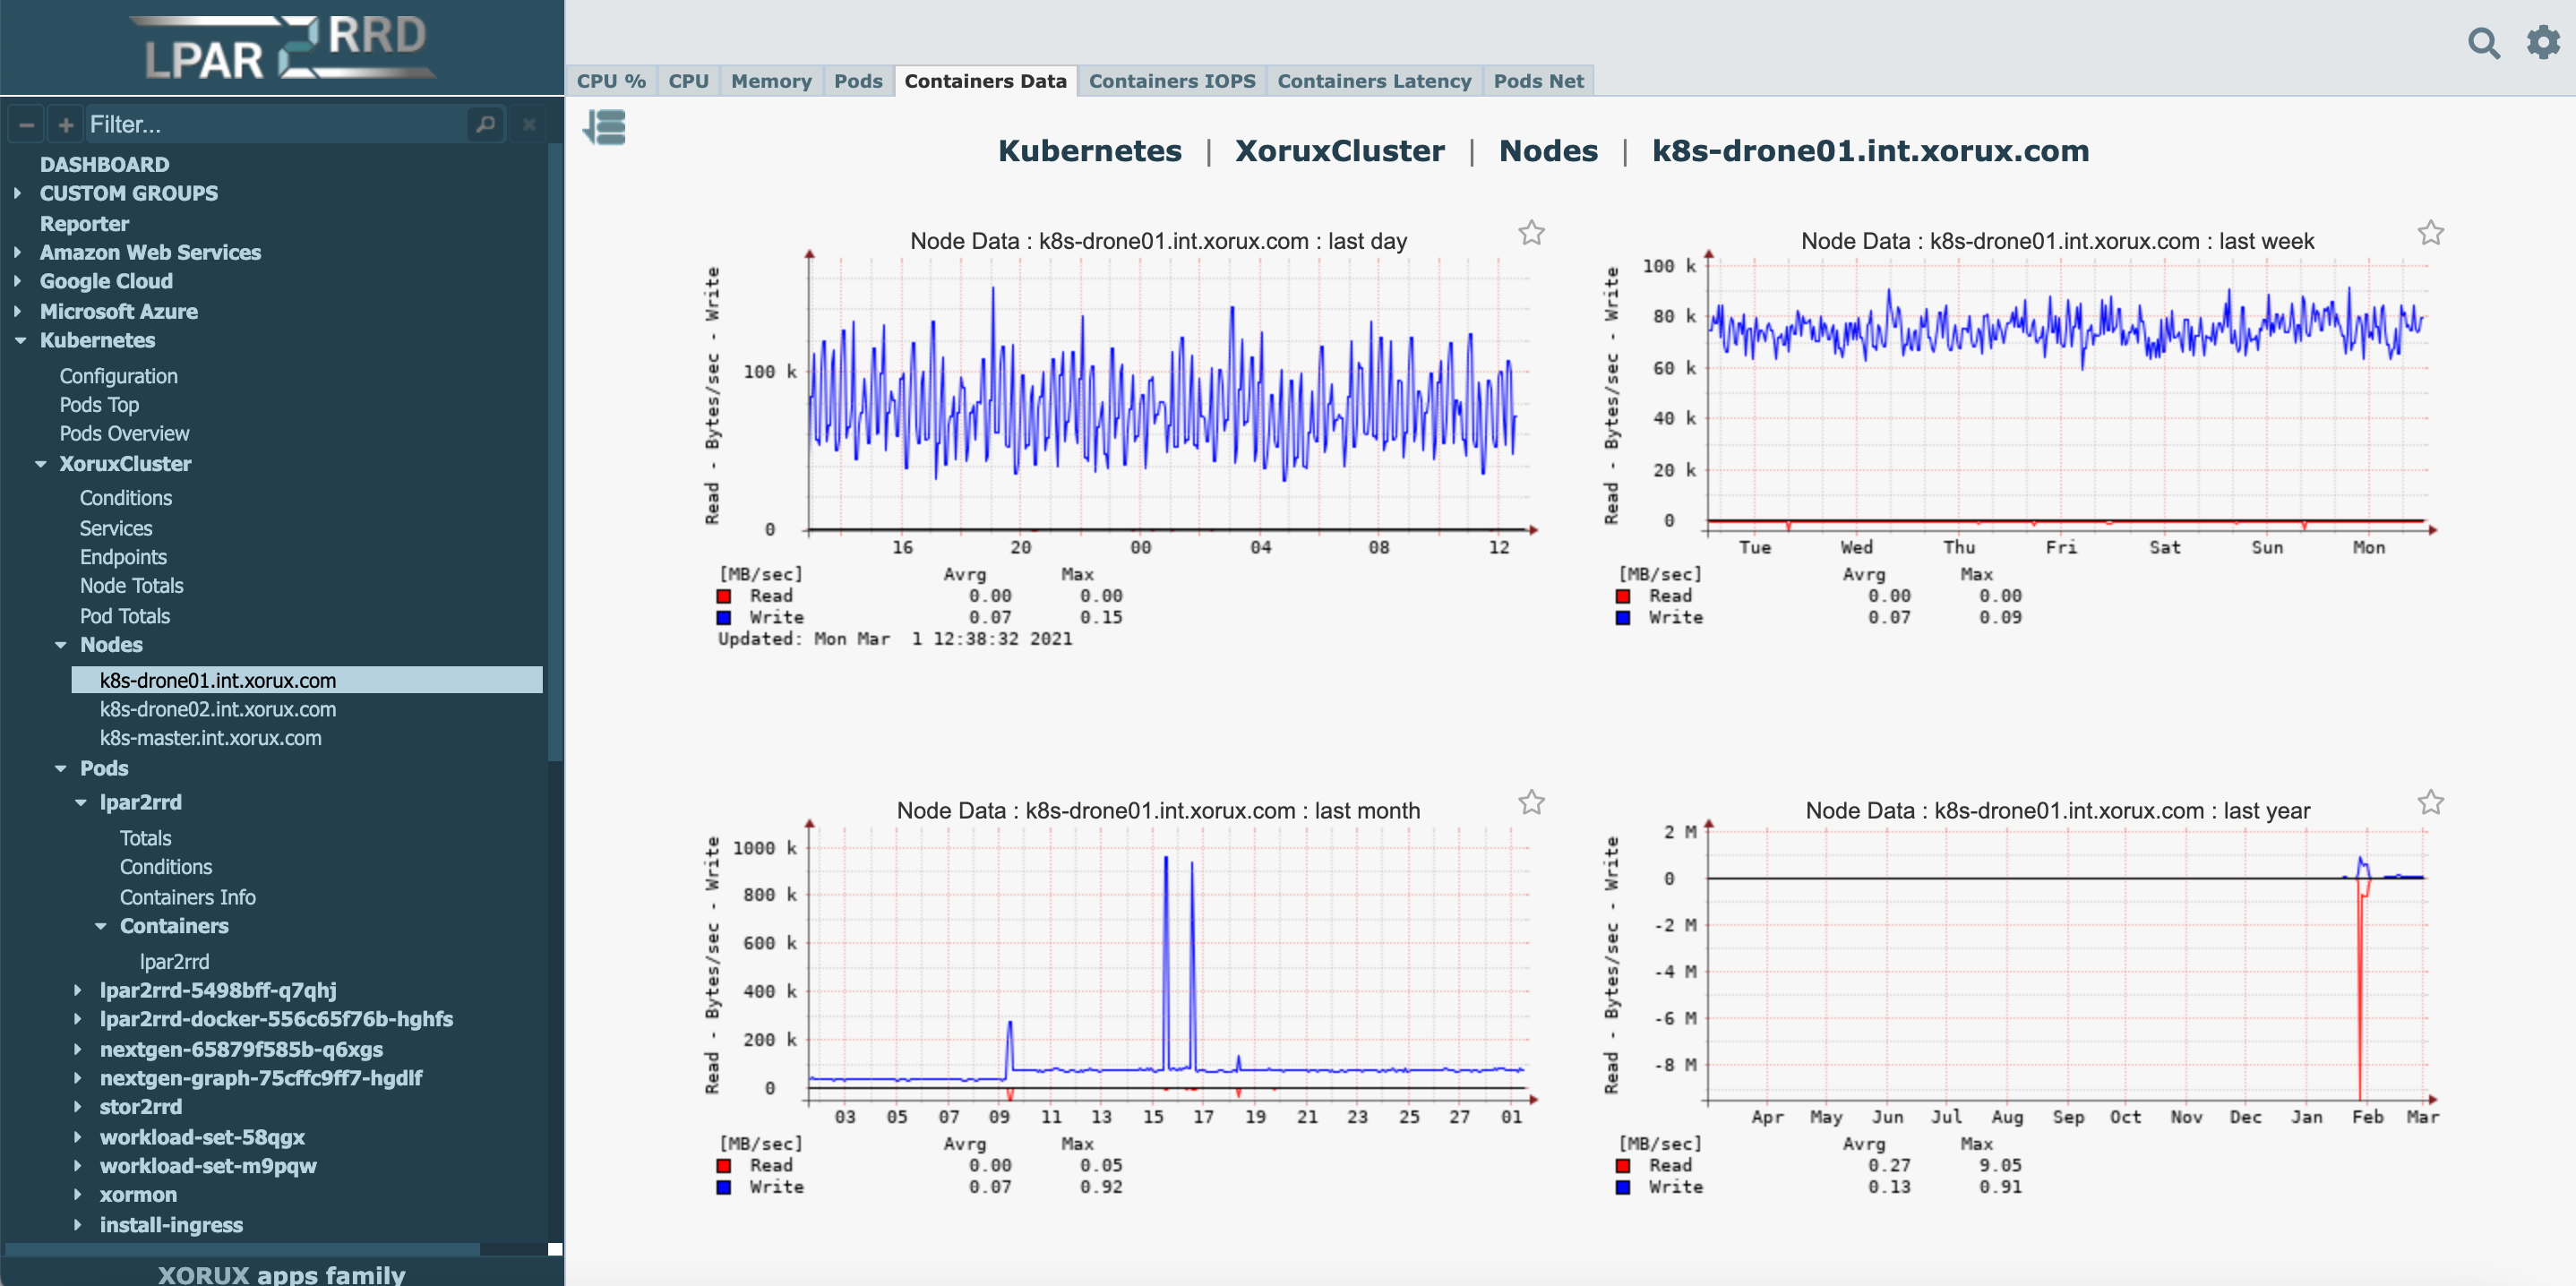
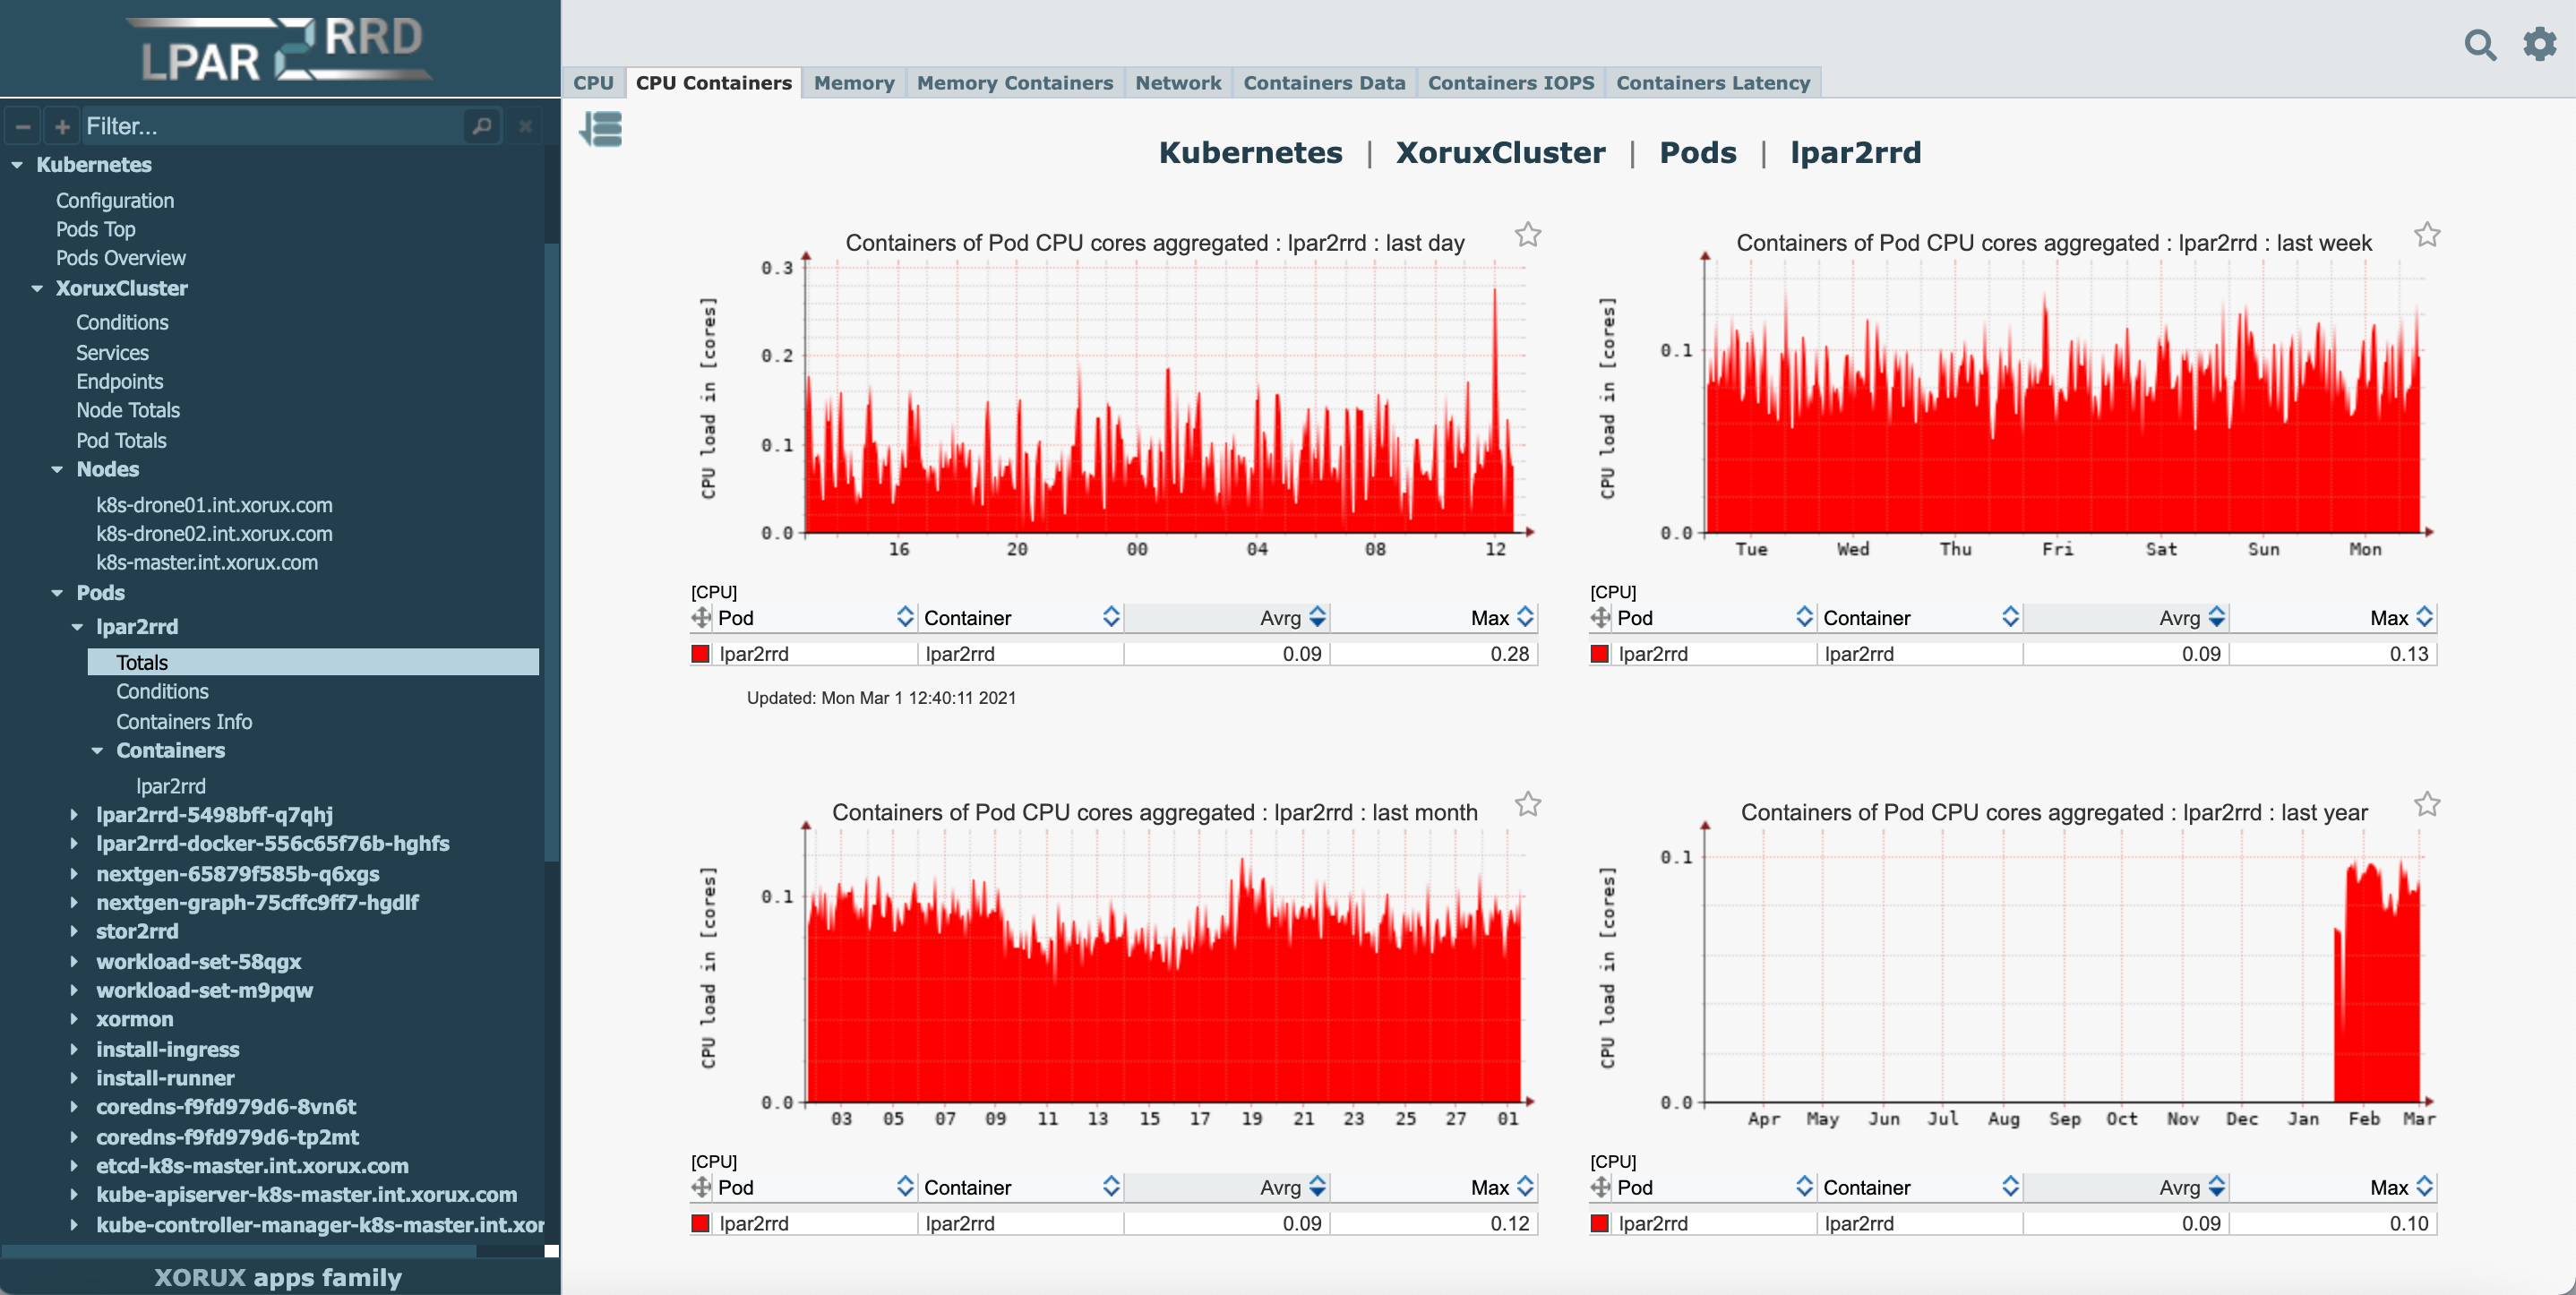
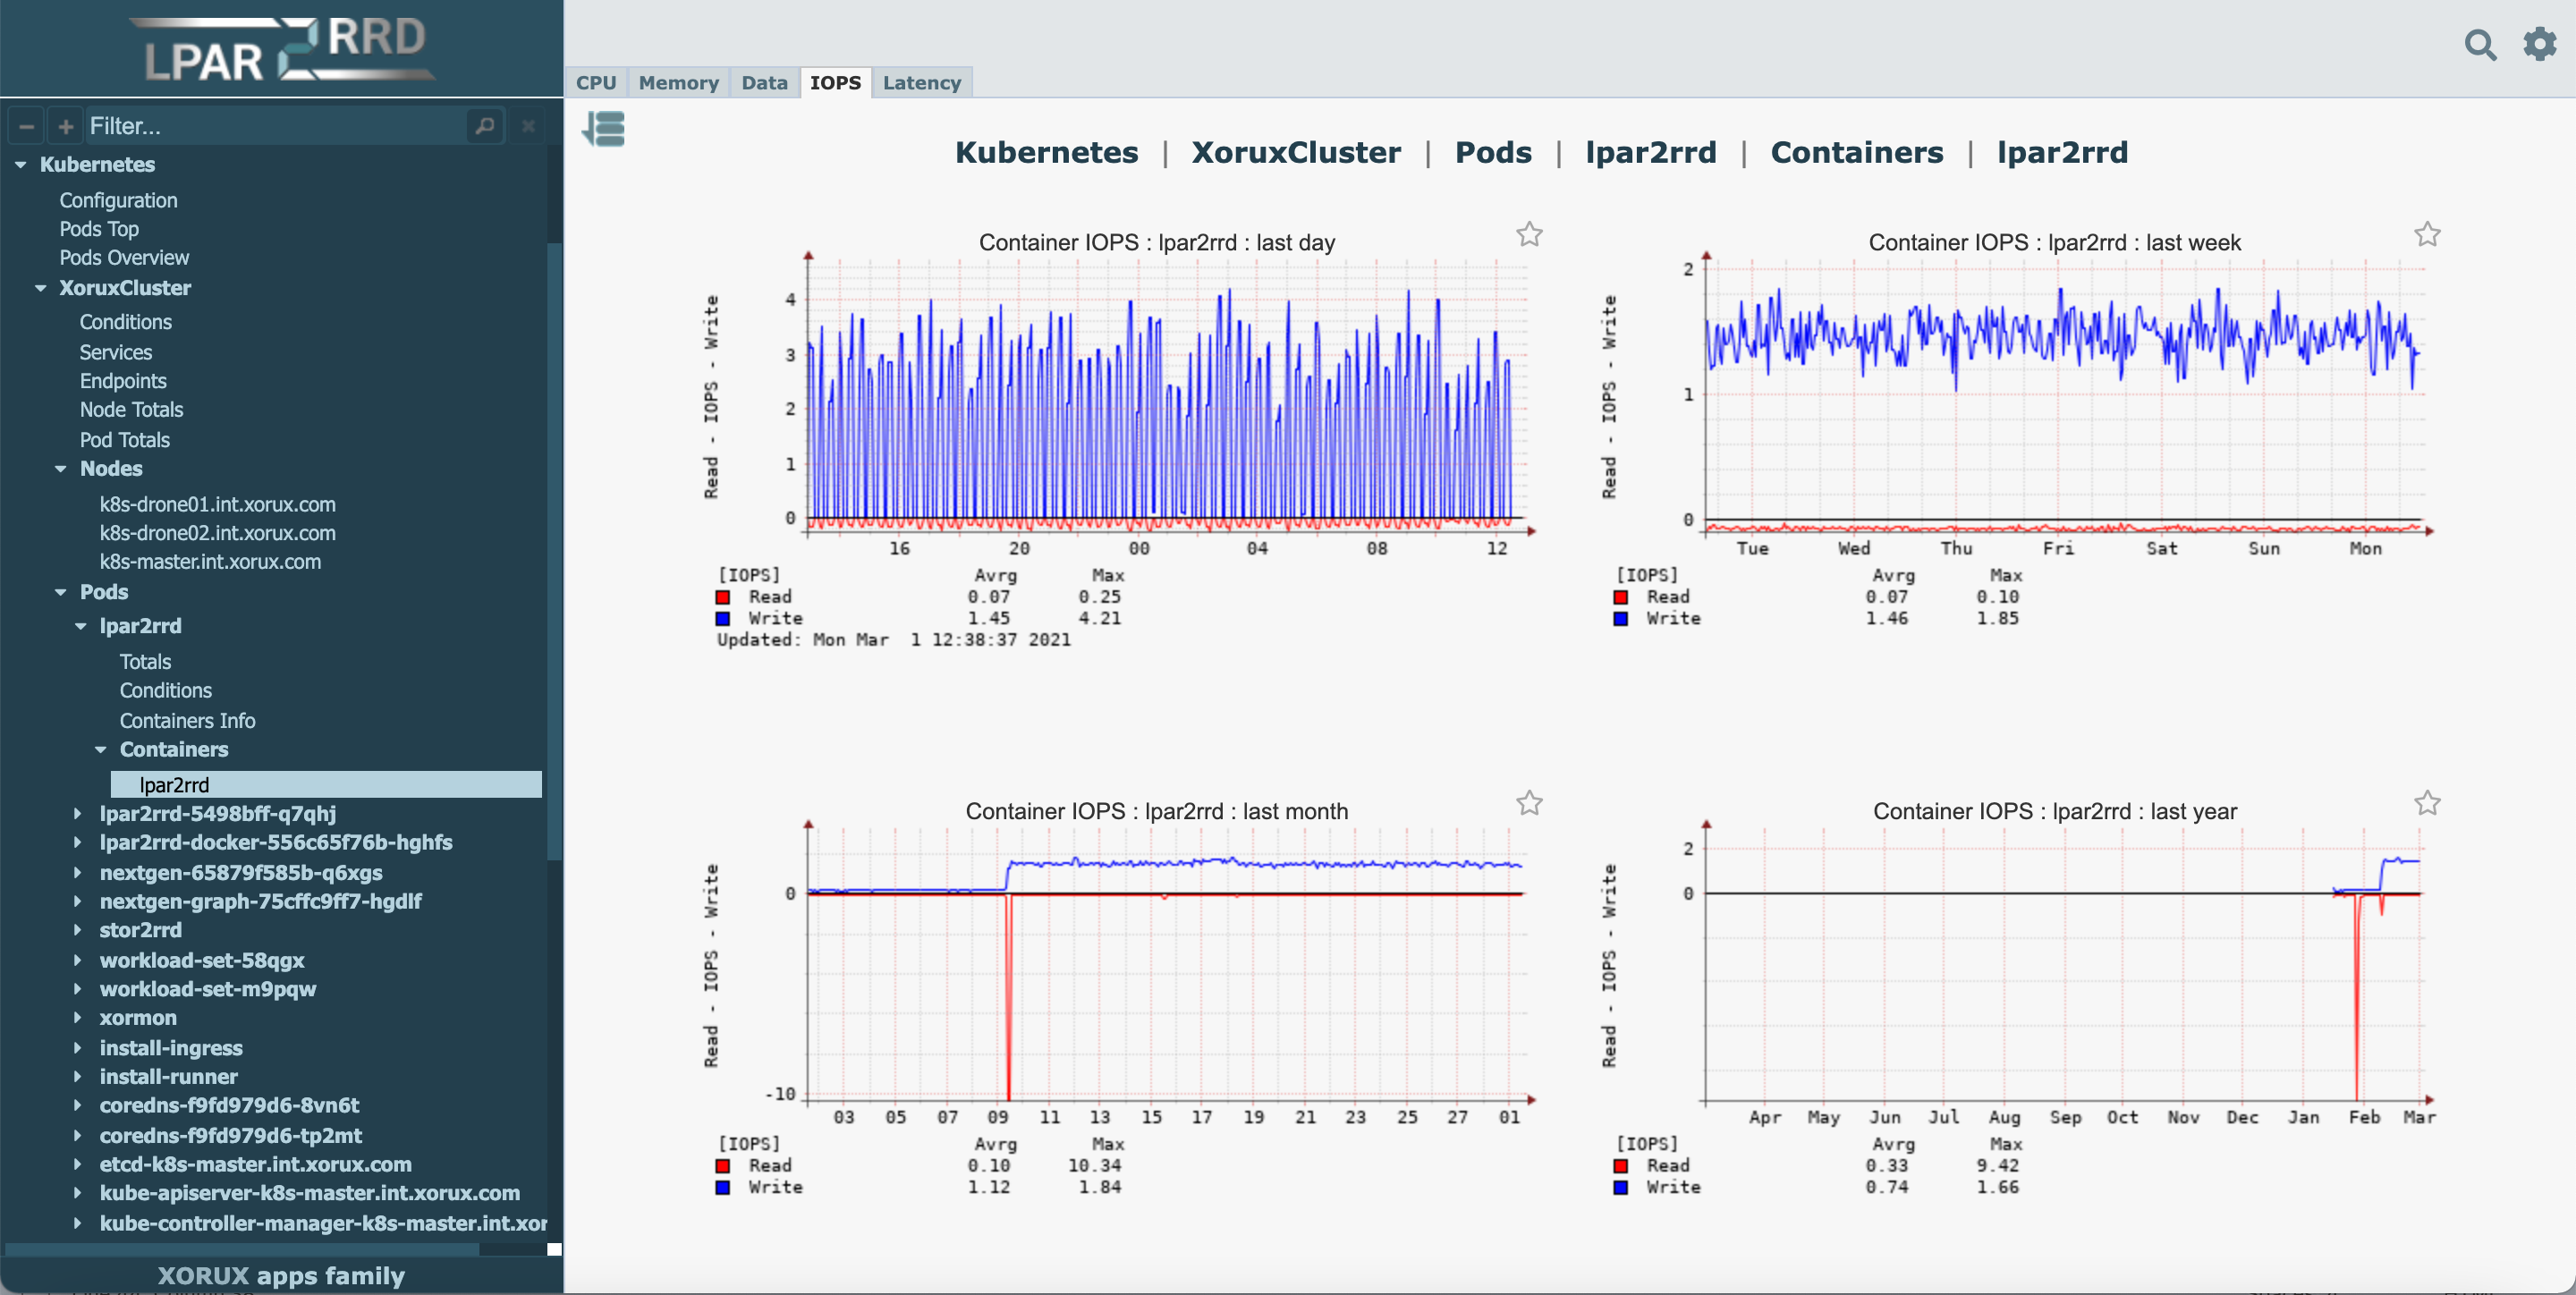
Examples
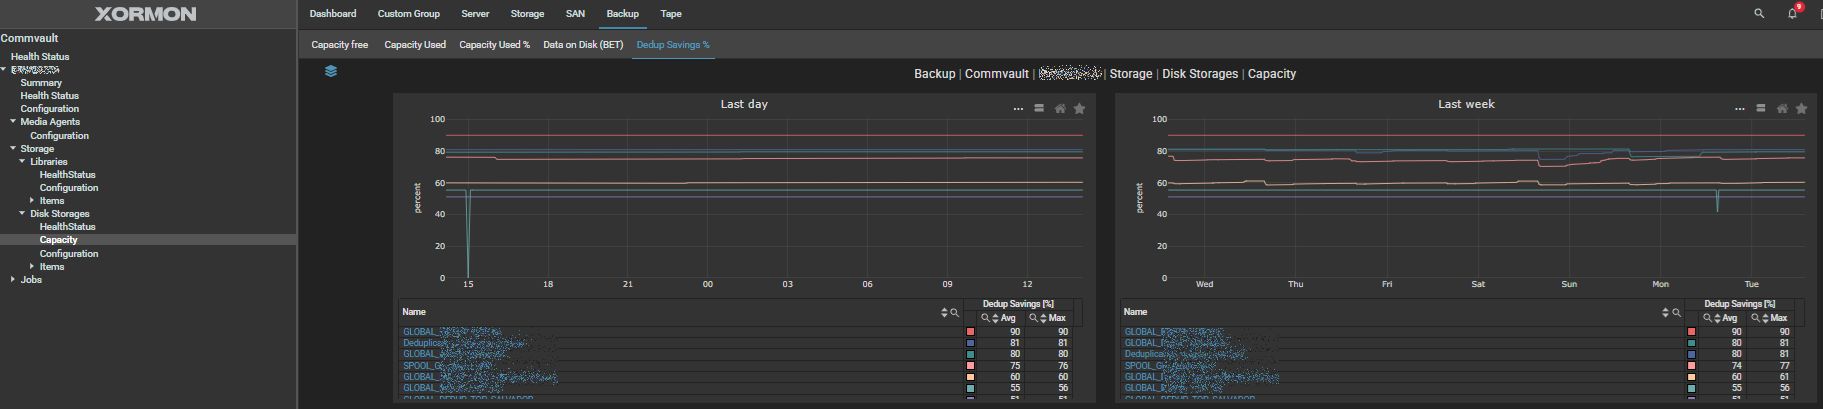
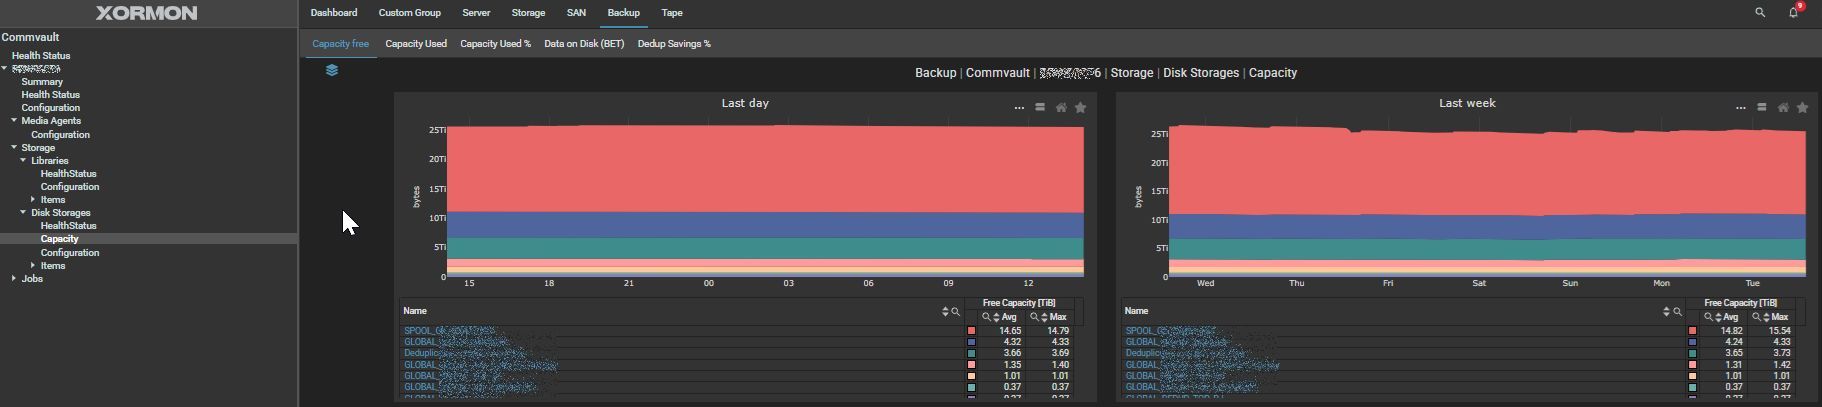
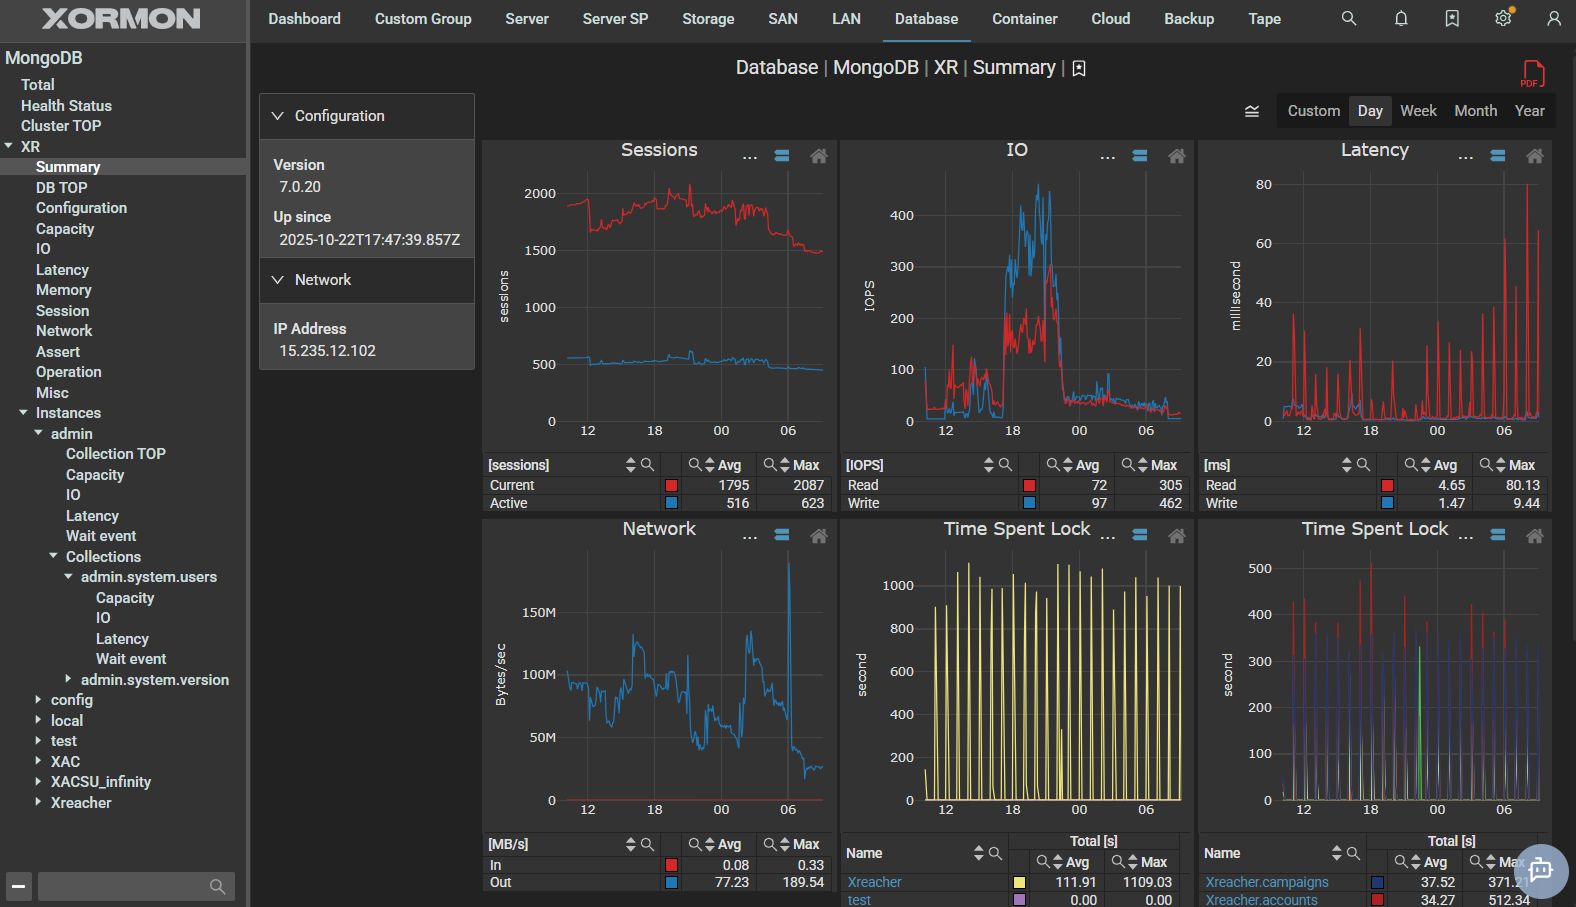
Summary
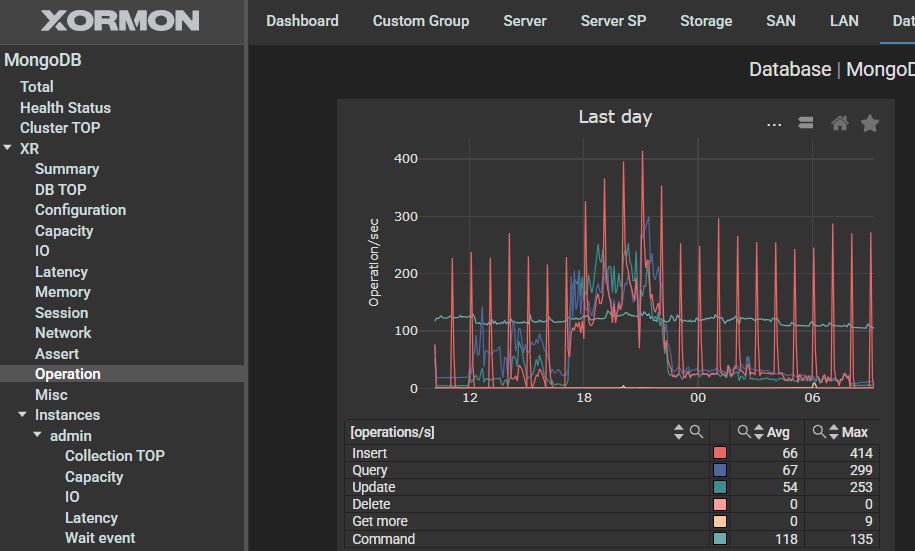
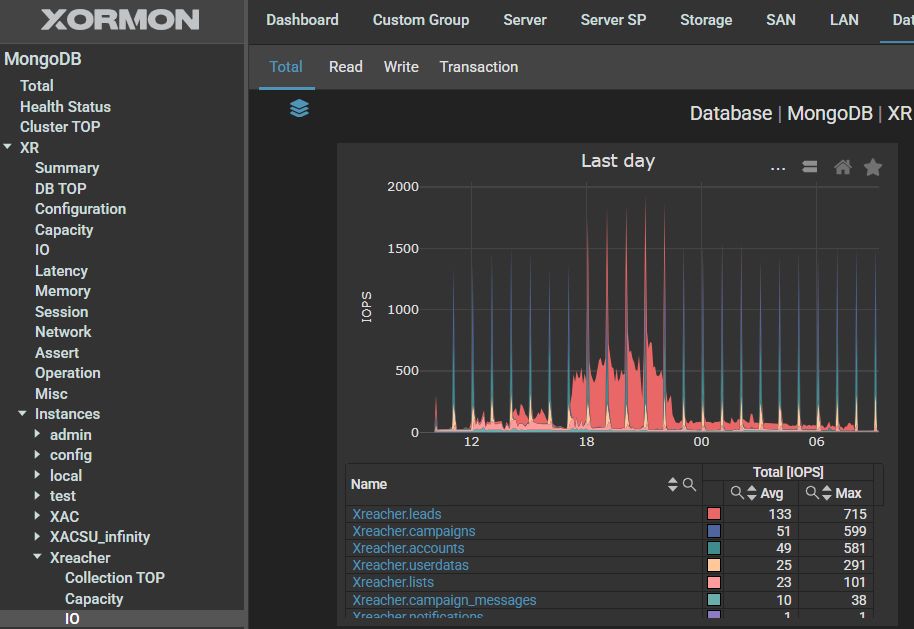
Drive usage in time
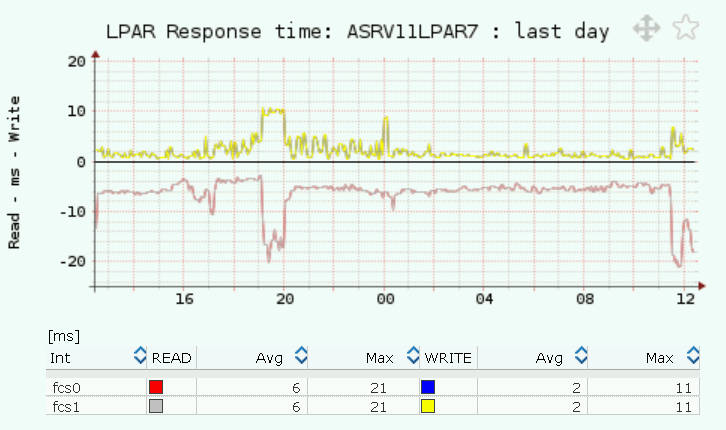
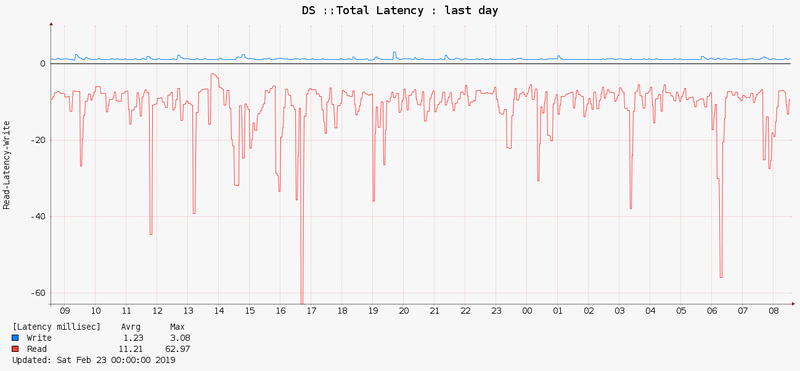
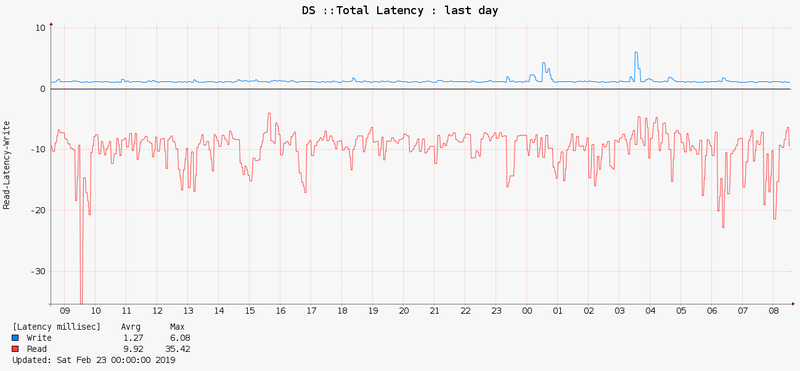
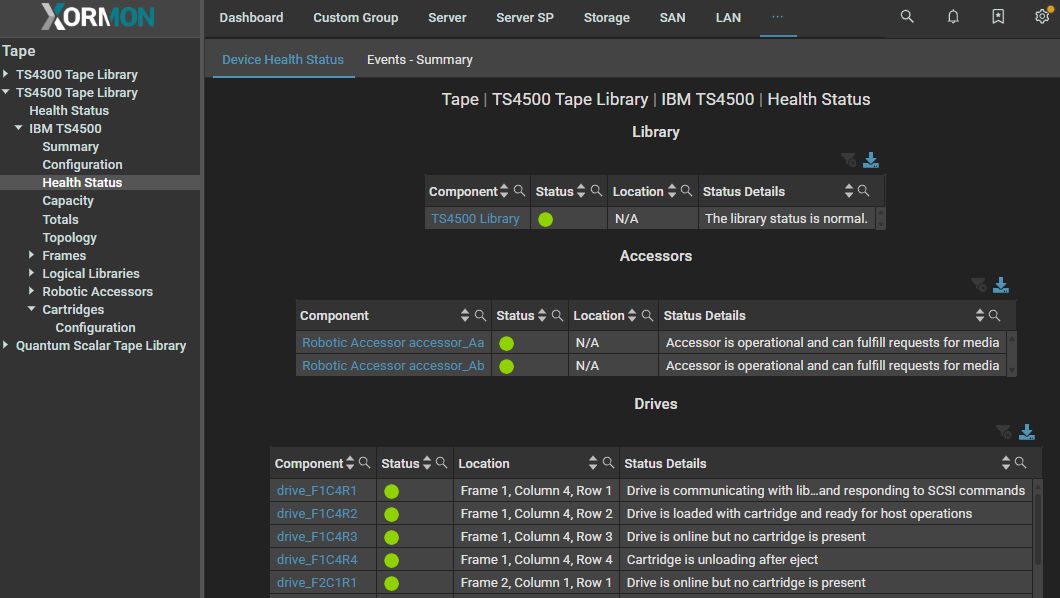
Health Status
The product supports IBM TS4500 and TS4300 tape libraries.
Monitored scope
- Health status:
- All HW components
- Event log
- Configuration: complete configuration, all components
- Environmental conditions: temperature, humidity
- Capacity total and compressed
- Performance
- Data (read/write)
- Compression rate
- Tape mounts
- Tape Export, Import
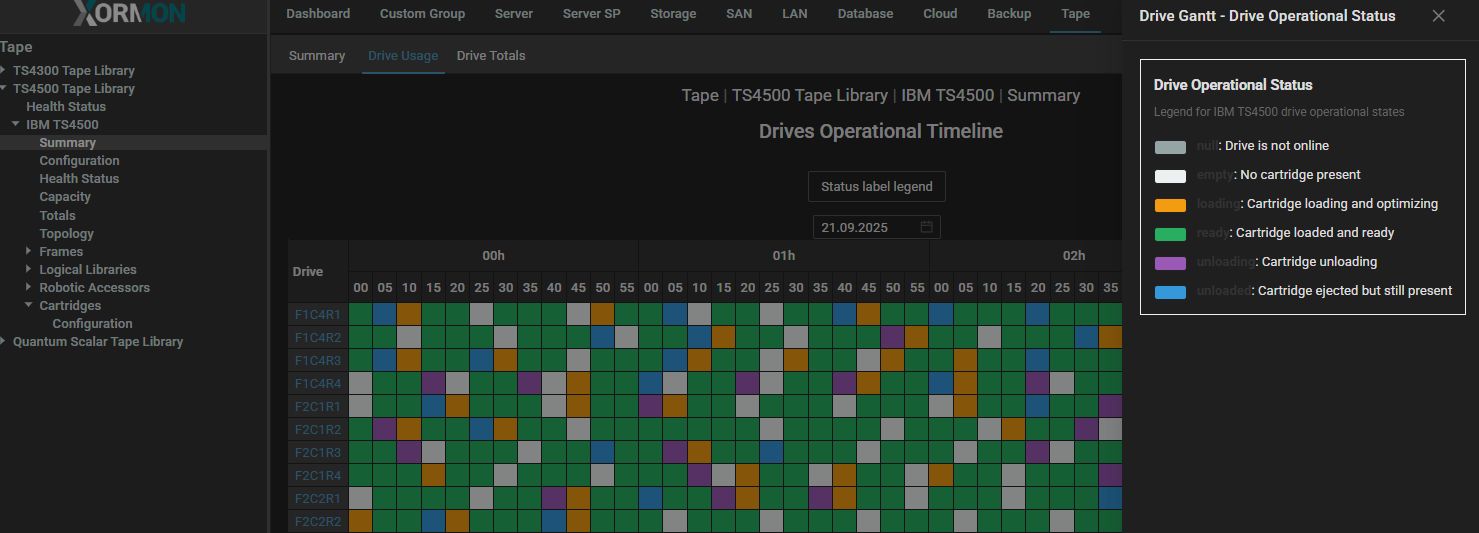
- Drive usage in time
- Topology
- Frame
- Configuration
- Slots
- I/O Stations
- Power supplies
- Ethernet ports
- Logical Libraries
- Configuration
- Capacity
- Drives
- Ports: FC, SAS
- Data Catrige
- Robotic Acessors
- Cartrige
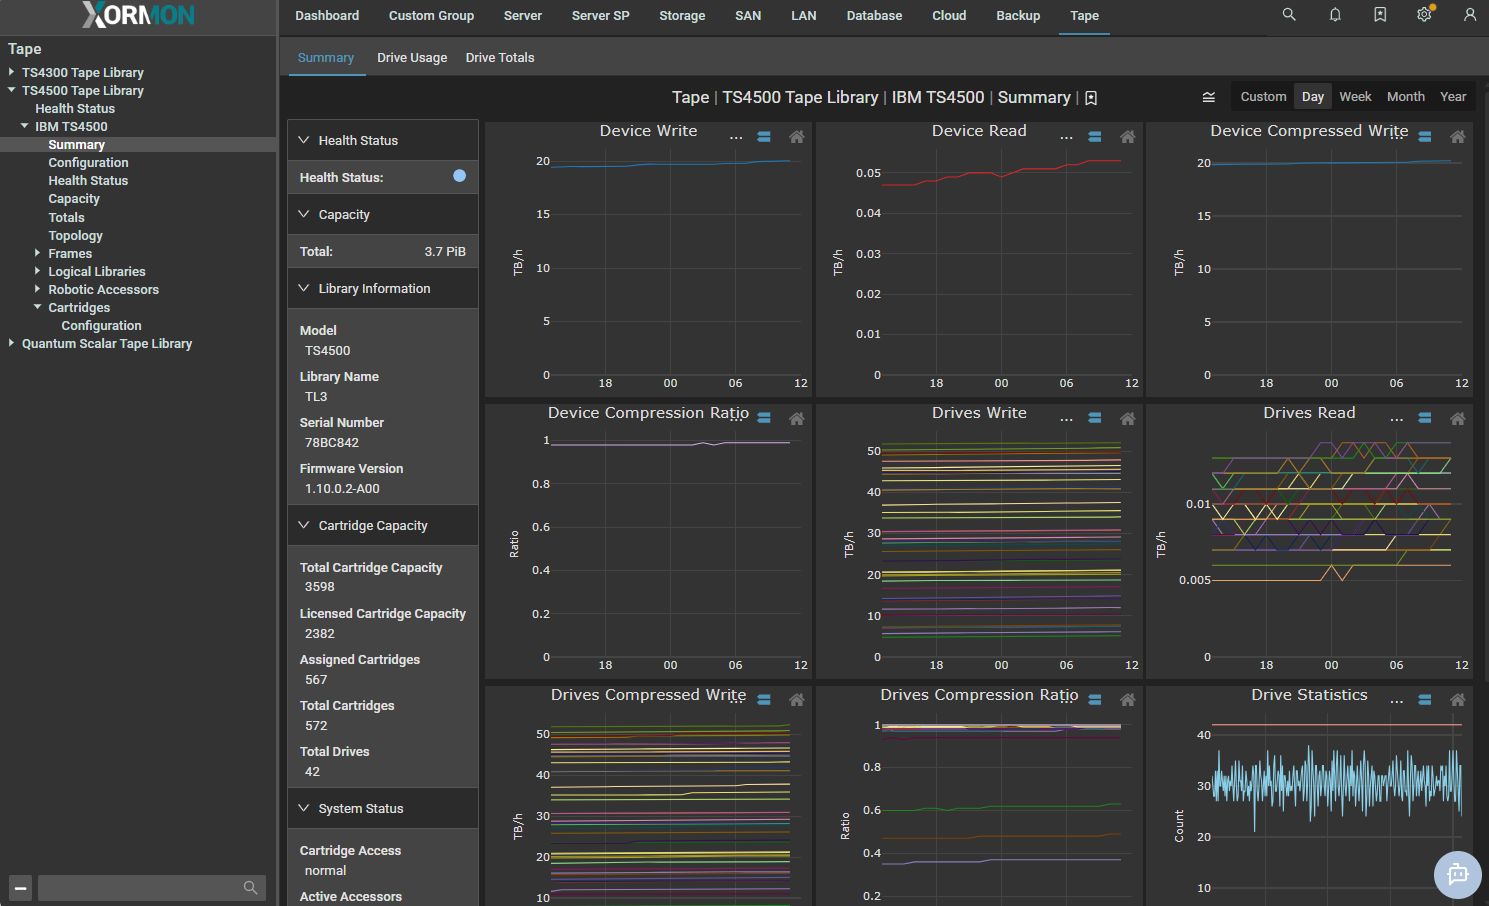
Examples
Summary
Drive usage in time
Health Status