IBM FlashSystem: Port Slow and Aborted Host IO
XorMon shows, for every host-attachment port of IBM SAN Volume Controller, Storwize and FlashSystem, how many host read and write operations per second were slow or aborted.
That feature will be available since XorMon v2.5.0 (Jan 2027)
Overview
IBM Storage Virtualize counts two kinds of problem operations on the ports that connect hosts (Fibre Channel, iSCSI, NVMe over TCP/RDMA):
Slow operations: data transfers of host reads or writes that exceeded the system's latency threshold.
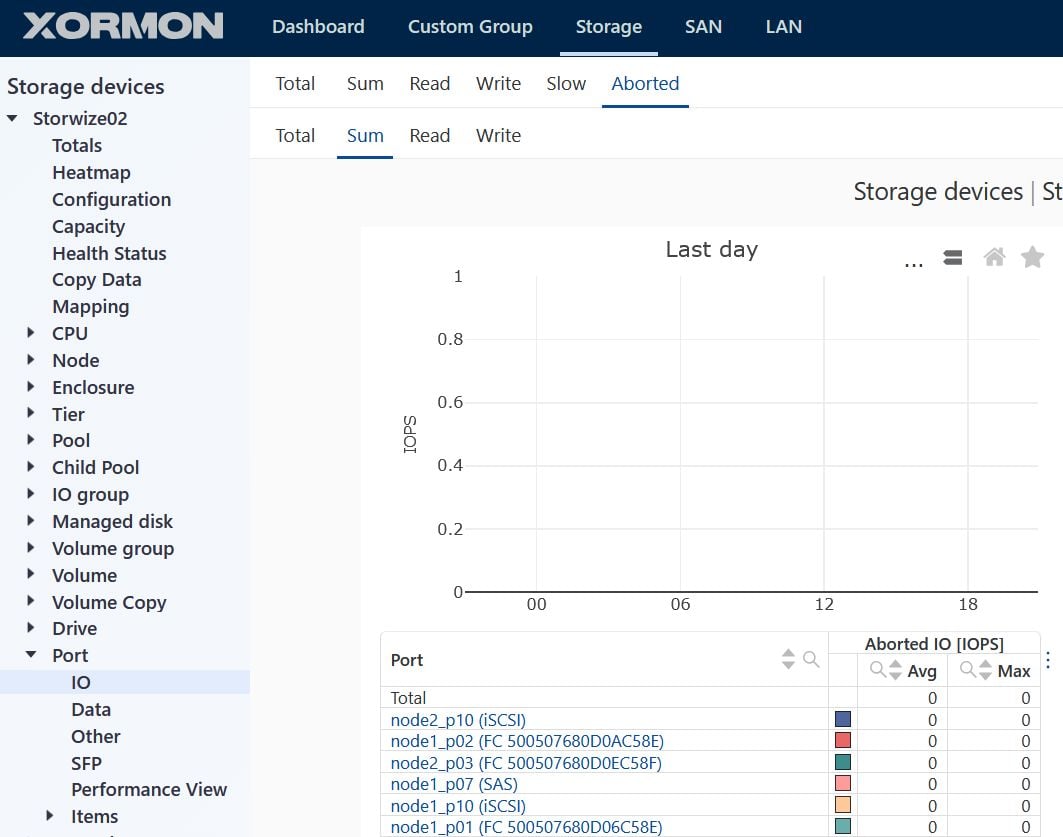
Aborted operations: host reads or writes stopped while the data transfer was in progress, either by the host or internally by the storage system (typically timeouts or connection problems).
Throughput alone does not show these problems. A port can move normal data rates while some operations are slow or aborted, which hosts experience as latency spikes, retries or path errors. The metrics help to find the affected port and node and to correlate it with SAN or host-side events.
Metrics
The storage reports cumulative counters per node port in its I/O statistics files. XorMon takes the increase over each collection interval and shows it as operations per second (IO/s), so 0 means no new slow or aborted operation in that interval. Read and write are seen from the host side: a read sends data to the host, a write receives data from it.
| XorMon metric | IBM counter | Unit | Meaning |
|---|---|---|---|
| Slow IO | hsr + hsw | IO/s | All slow host operations |
| Slow IO Read | hsr | IO/s | Host reads whose data transfer was considered slow |
| Slow IO Write | hsw | IO/s | Host writes whose data transfer was considered slow |
| Aborted IO | har + haw | IO/s | All aborted host operations |
| Aborted IO Read | har | IO/s | Host reads aborted while the data transfer was in progress |
| Aborted IO Write | haw | IO/s | Host writes aborted while the data transfer was in progress |
The latency threshold that marks an operation as slow is set by the storage system, not by XorMon.
Supported ports and firmware
The counters come from the node statistics (I/O statistics files) and depend on the firmware level and the port type.
| Port type | Firmware | Notes |
|---|---|---|
| Fibre Channel | 8.5.0 and later | Slow and aborted counters reported |
| iSCSI | 8.5.0 and later | Slow and aborted counters reported |
| NVMe over TCP, NVMe over RDMA | 9.1 and later | Slow and aborted counters reported; also shown by the CLI command lsportstats from 9.1.3 |
| PCIe, IP replication | none | No such counters, graphs stay empty |
Firmware older than 8.5.0 does not report the counters at all; the graphs for such systems stay empty.
Where to find the graphs
| Page | Tab | Subtabs | What it shows |
|---|---|---|---|
| Storwize device → Port → Totals → IO | Slow | Total, Sum, Read, Write | All ports of the device: Total = read and write summed over ports, Sum = each port's share stacked, Read / Write = each port stacked |
| Storwize device → Port → Totals → IO | Aborted | Total, Sum, Read, Write | The same for aborted operations |
| Single port | Slow IO | Total, Read, Write | One port: all, read and write slow operations |
| Single port | Aborted IO | Total, Read, Write | One port: all, read and write aborted operations |
How to read the graphs
On a healthy system both metrics stay at 0 most of the time, so a flat line at zero is the expected state.
Occasional small values: isolated slow operations during load peaks are usually harmless.
Repeated slow operations on one port: points to that port's path, for example a congested or faulty SFP, cable or switch port, or a busy host. Compare with the port's IO, CRC errors and SFP power graphs.
Aborted operations: hosts or the system gave up on transfers, often because of timeouts, link resets or host multipath failovers. Check the host and SAN switch logs for the same time.
Slow or aborted operations on all ports at once: more likely a problem of the storage system itself (node load, back-end latency) than of a single path.
The counters start from zero when a node restarts; the first interval after the restart shows the operations counted since then.
Examples
Slow Host IO: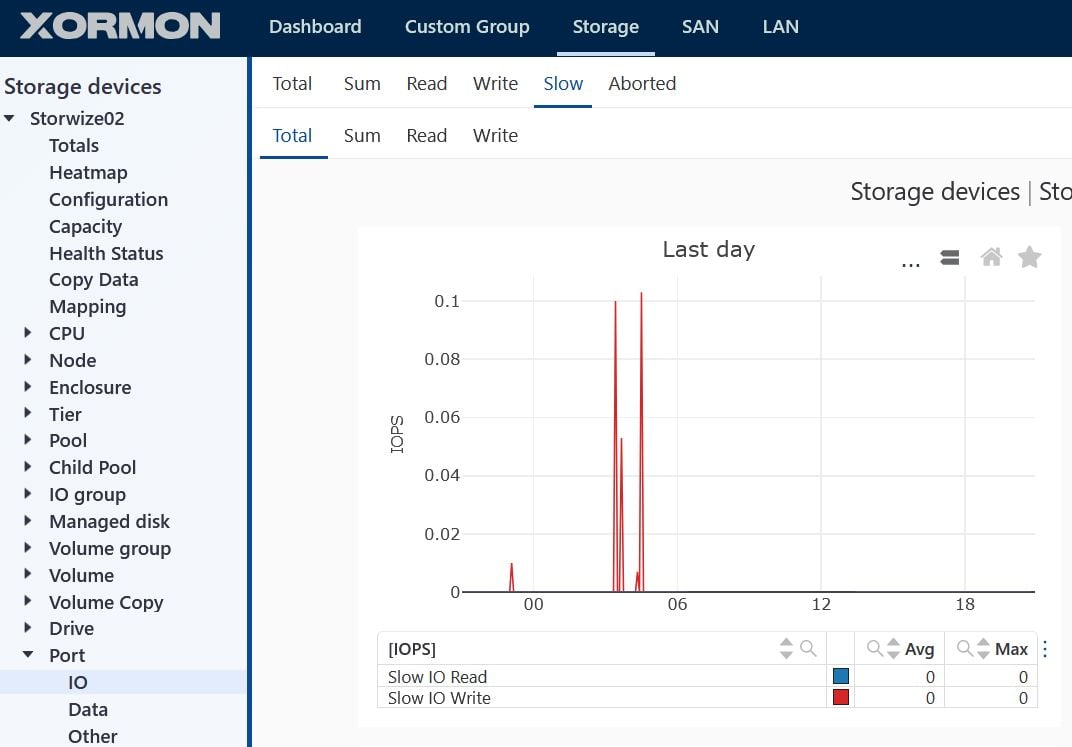 |
Aborted Host IO:
 |
Dernière mise à jour :