Custom Group
Custom Group is a collection of objects sharing a common use, location, project, etc.
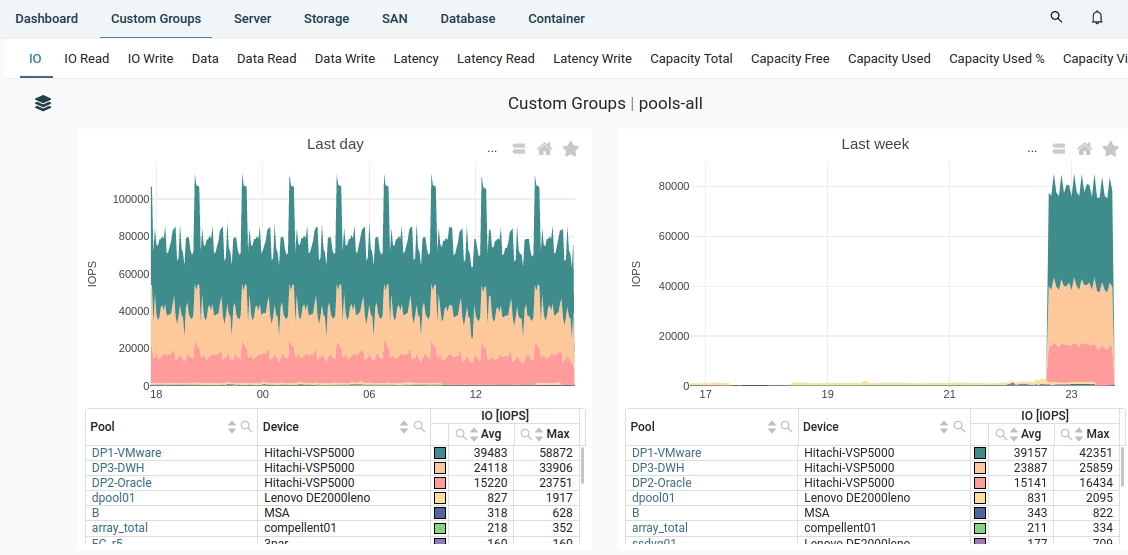
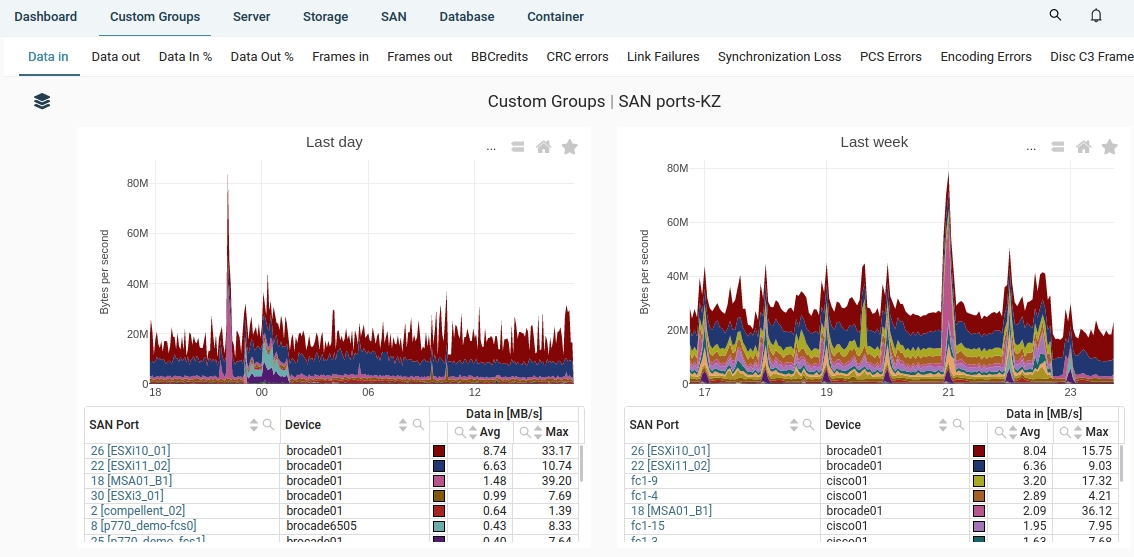
Performance metrics for objects in the Custom group can be then viewed in one place.
Only objects of the same type (class, hardware type and subsystem) can be assigned to a Custom group.
For example:
- IBM Power, LPARs
- VMware VMs
- Storage Volumes
- etc.
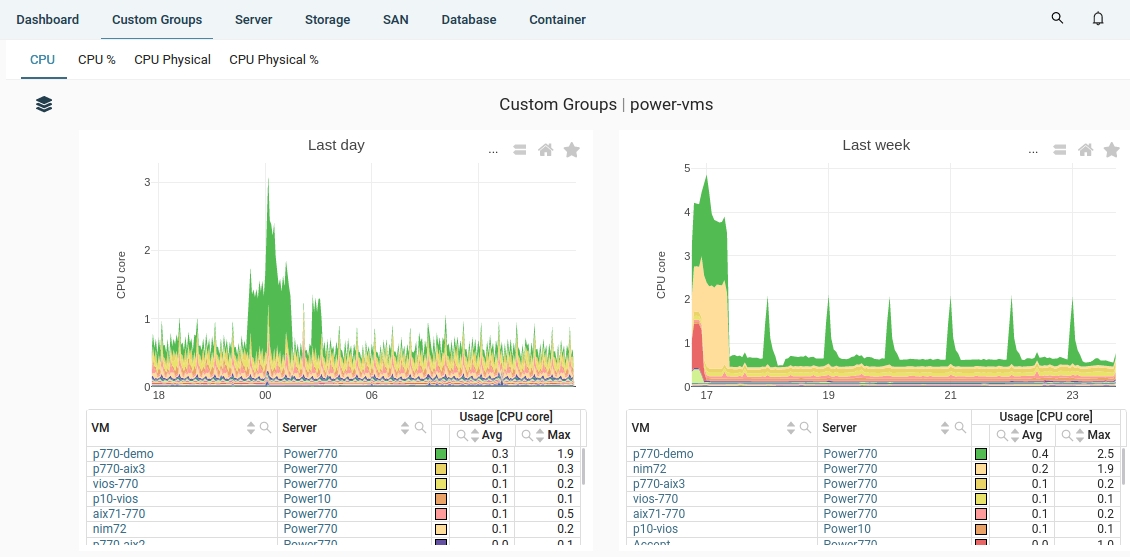
There is one exception. Virtual machines from various virtualization platforms, including IBM Power LPARs, can be combined in a single Custom group.
Only common subset of performance metrics is shown in this case: CPU usage in Cores and %.
Custom Group can be used in other tools throughout Xormon NG.
You can create an Alerts, Reports or Exports for any Custom group.
Custom Group can be organized into folders for easier acces.
It can be also shared with other users (Custom group sharing).
Creating Custom Group
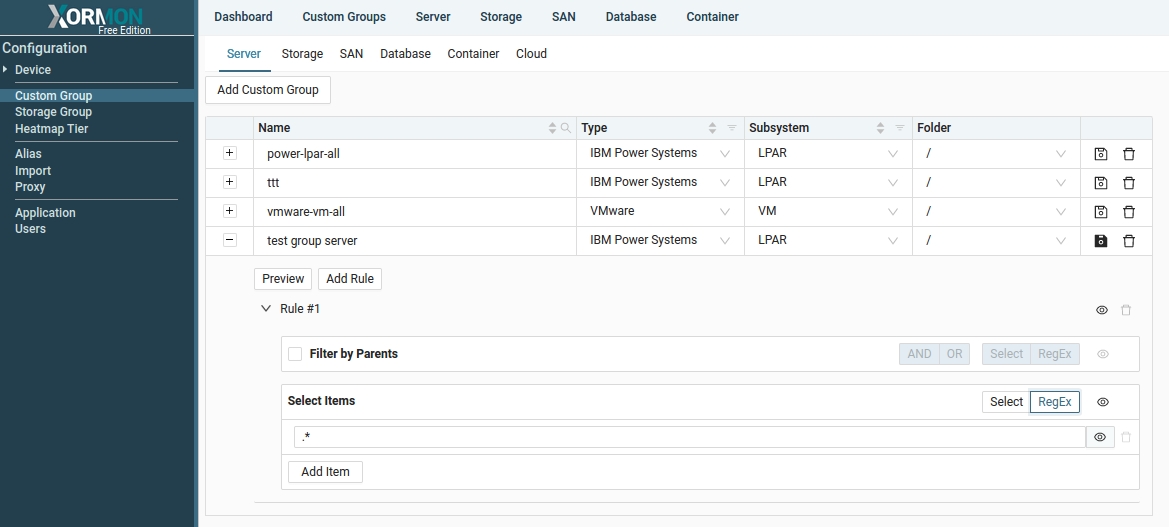
- UI ➡ Settings ➡ Custom group
- Select Class in the top menu (Server, Storage, SAN...)
- Add Custom group
- Assign name
- Select Type and/or Subsystem
- Select folder (Create a new one if needed)
- Select items
Item selection supports:- Filtering by parent objects
- Direct selection
- Regular expressions
- Selection by tags
- Multiple rules for fine-grained selection
- Save the Custom group
 |
Newly created Custom Group are immediately displayed in the top navigation menu.
Subsystems available in Custom Group
- IBM Power Systems
- LPAR
- Server
- Shared CPU Pool
- VMware
- Cluster
- Datastore
- ESXi
- VM
- Nutanix
- Host
- Storage pool
- Storag Container
- VM
- Proxmox
- Node
- Storage
- VM
- Oracle VM
- Server
- VM
- Linux
- Server
- Windows / Hyper-V
- Cluster
- Server
- VM
- Cross Platform (all server VMs)
- VM
 |
Example: VMware VMs
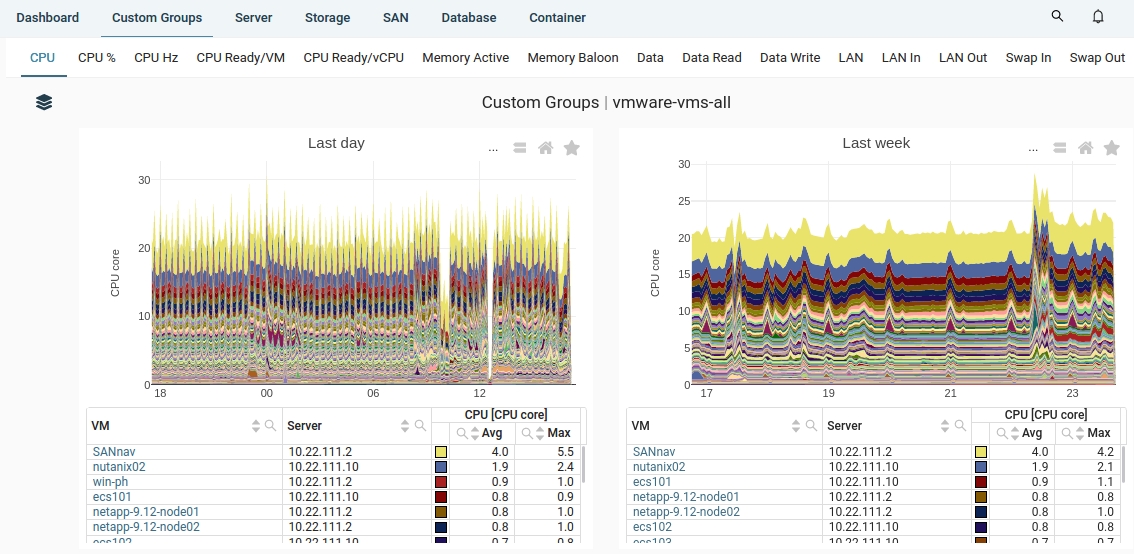 |
- IBM Db2
- Buffer Pool
- Member
- Oracle DB
- Instance
- PostgreSQL
- Cluster
- Instance
- MS SQL Server
- Cluster
- Instance
- Docker
- Container
- Volume
- Kubernetes
- Container
- Namespace
- Node
- Pod
- RedHat OpenShift
- Container
- Namespace
- Node
- Pod
- AWS
- MS Azure
- Google Cloud
- Cloud Compute
- Cloud Database
